Trust in Numbers
Questioning data and statistics.
Statistics should be questioned as well.
People in the western world have build up trust in statistics (quantitative data), see e.g. T.M. Porter, 1996. They convey a feeling of reliability, sometimes even academic evidence. But this can turn into a downside. A good example is the climate change discussion. Climate change deniers are famous for cherry picking data to make their argument, for example, selecting a certain timespan which is not representative for the overall time series (Schneider et al. 2014). Even more dangerous is the transformation of such data sets in easily to digest forms, for example, graphs. Such representations seem to inherit the feeling of reliability (“aura of truth”: Monmonier, 1991 or “communicative objectivity”: Halpern, 2014). Furthermore, such visualisation can also be manipulated through deceptive techniques in order to make a certain argument, see figure 1 (Pandey et al. 2015).

A good example for bad statistics emerged over the last few days. The website Testberichte.de published a study on the 14.03.2018. The study contained a ranking of broadband speeds in 110 German cities. Rankings are particulary interesting for the press (Focus, Bild, T-Online, Der Tagesspiegel, Berliner Morgenpost 1. and 2., Berliner Zeitung). The data source is the web portal Breitbandmessung.de, which was commissioned by the Bundesnetzagentur. Most articles mention the federal institution, as it tries to increase trust in the statistics, even though, the institution is in no way related to the study.
Why is the underlying data of the Testberichte.de ranking not good enough?
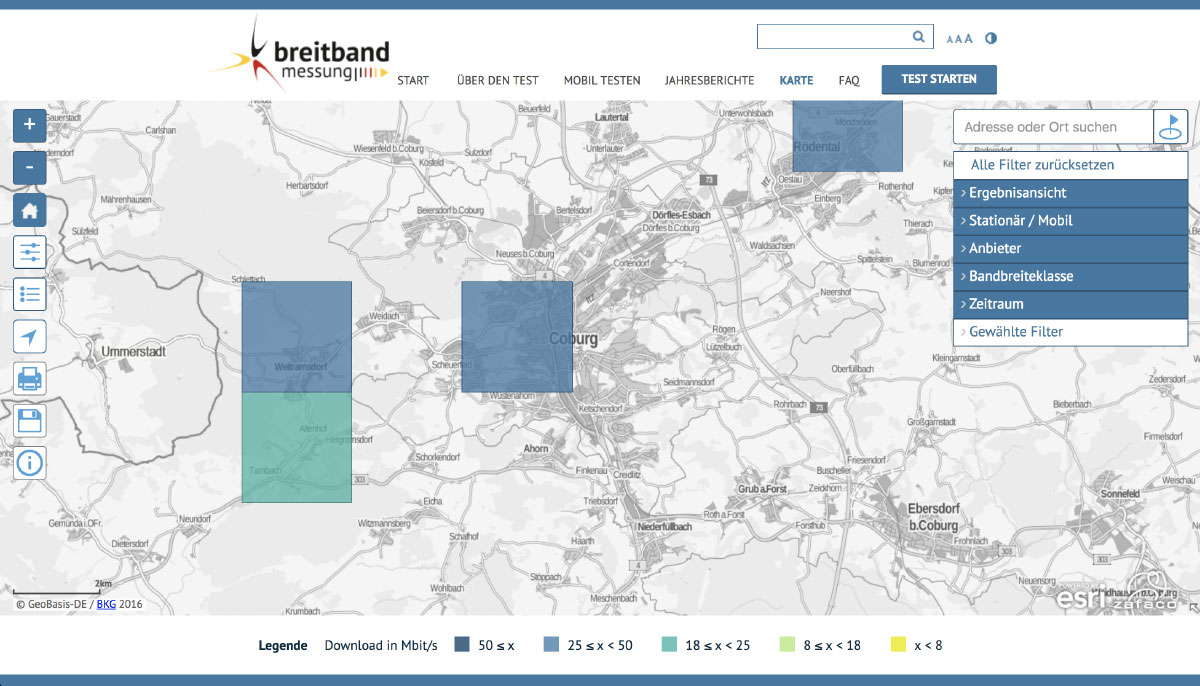
Breitbandmessung.de is an open web portal, which allows citizens to measure their personal internet connection’s speed. In order to do so, the site asks vistors a series of questions and, thereby, defines their spatial location, etc. This means that there is no systematic sampling method behind the site’s data collection, it is completely based on participating users. During 2016/17 437.192 stationary broadband connections were part of the test and 245.143 mobile connections. In the previous time frame there were 106.159 stationary and 53.651 mobile connections. The sample size itself is not bad. The problem lies in the representativeness of the sample as well as having no knowledge about its temporal and spatial distribution. Especially in small towns there is no guarantee, that the sample size is big enough to interpolate the information. The city who won the ranking does not even have enough data points to cover the full city (see figure 2).
In addition, what is the user’s motivation to visit the site (e.g. their internet connection is particularly slow). And on top there are several reasons why the data is not correct, some of those reasons are even listed on breitbandmessung.de: from using a badly configured access point, to up- and downloads running in parallel to the test to old cables in your house or a bad contract with your provider. The site breitbandmessung.de is very transparent about this (sorry no english quotes): “Bei der vorliegenden Stichprobe handelt es sich nicht um eine Zufallsstichprobe, sondern es konnten alle Kunden teilnehmen, die Kenntnis von der Breitbandmessung erlangt haben und gleichzeitig motiviert waren, die Messung bei sich durchzuführen.” “Die berechneten und dargestellten Werte können möglicherweise von den tatsächlichen Werten in der Grundgesamtheit abweichen.” Even the insights one is able to deduce from the data is contextualized: “Dies liegt insbesondere an kleinen bis sehr kleinen Stichproben für die jeweils dargestellte Region.” And the federal institution makes it very clear that the data cannot be used to learn anything about the broadband availability in any area: “Messungen lassen keine Rückschlüsse auf Breitbandversorgung zu: Die Ergebnisse der Breitbandmessung hängen davon ab, welchen Tarif der Nutzer mit dem Anbieter vereinbart hat. Insofern können auf der Grundlage der Breitbandmessung keine Aussagen zur Versorgungssituation oder Verfügbarkeit von breitbandigen Internetzugangsdiensten getroffen werden.”
The site breitbandmessung.de as well as the Netzagentur was not responsible for the study (confirmed via phone). Breitbandmessung and the federal institution only publish annual reports. Even in those reports there are no insights about individual cities, because, the data does not provide insights at that granularity. Better data on Germany’s broadband expansion can be found in the German Breitbandatlas by the Federal Ministry of Transport and Digital Infrastructure (BMVI), which is produced in a systematic way by TÜV Rheinland.
So Germany’s broadband expansion is doing fine?
Yes and no. As the Breitbandatlas shows, there are many cities and areas throughout Germany which still require a lot of work. We have analysed Berlin’s latest report on the broadband expansion and have shown that while areas with perfect access to high speed internet exist, there are areas like the district Pankow where roughly 47.000 citizens (interpolated) have no access to 50 Mbit/s or more. More on our statistical analysis can be found here.
How do I know if i can trust a statistic?
This is a tricky question. For a complete answer you would need to do some research and have a basic understanding of statistics. But often it is already enough to check where the data is coming from and who that organisation is. In our case testberichte.de is a commercial website that generates their profits from selling third party test reports on consumer products. Their most important interest is getting as many users as possible on their website and generate conversions. Is this the kind of company you want to get your statistics report from? Ideally journalists check the data they include in their stories before they publish them. Good German data sources are, for example, statistisches Bundesamt or the statistischen Landesämter.
References
- Halpern, O. (2014). Beautiful data. Duke University Press.
- Monmonier, M. (1991). How to Lie with Maps. Chicago & London: University of Chicago Press.
- Pandey, A.V.; Rall, K.; Satterthwaite, M.L.; Nov, O.; Bertini, E. (2015) How Deceptive are Deceptive Visualizations?: An Empirical Analysis of Common Distortion Techniques. Proceedings of the ACM Conference on Human Factors in Computing Systems 2015
- Porter, T.M. (1996) Trust in Numbers, Princeton University Press
- Schneider, B.; Nocke T.; Feulner, G. (2014) Twist and Shout: Images and Graphs in Skeptical Climate Media. In Image Politics of Climate Change: Visualizations, Imaginations, Documentations. Transcript Verlag