Berlin's Open Data Network
A cluster analysis shows which topics are most present in Berlin's Open Data Portal offerings and how different topics are interrelated
Context and Objectives
Open, freely-available data sets are collected centrally for the state of Berlin via the Open Data Portal Berlin. If you are looking for open data, this website is the first place to go. To ensure that specific datasets can be easily found by users amdist the portal’s abundant datasets, each dataset is described by various metadata, including keywords, also known as tags. These tags are used to quickly identify the content of each dataset and allow users to find other datasets on similar topics. For instance, the dataset on eMobility electric charging stations is described with tags like Elektro-Ladesäulen, Mobilität and Emobility, each of which are also used with other datasets. On average, each dataset is described by 11.7 tags. Our objective of this analysis was to determine which tags occurred most often with which other tags in order to outline a thematical network for all datasets available on the Berlin Open Data Portal. This allows us to understand which tags are common across themes, and which themes are typically closest to each other in terms of content. The data used for this analysis are the description tags from all 2,643 datasets available on the Berlin Open Data Portal at the time (March 15, 2021).
Getting Data and Extracting Tags
The data register, which is responsible for the input and storage of all data records in the Berlin Open Data Portal, is based on the widely used software CKAN (Comprehensive Knowledge Archive Network). CKAN offers an API, i.e. an interface for programming applications. This makes it possible, for example, to perform a search or analysis on the contents of the portal that goes beyond the possibilities of the web interface. You can read more about CKAN in the context of the data portal here.
We used the CKAN API to access data about the tags used in Berlin’s portal. Using the R package ckanr, we made a request query to access the metadata for all datasets of the Open Data Portal. The output of this query is a JSON object (which can be presented as a table), with each row containing information on a different dataset from the Open Data Portal. One of the columns within this table contains a list of all tags associated with a given dataset, which is precisely the information we needed to complete this project.
We separated these tags and proceeded to clean them in order to avoid duplicates. More precisely, we uniformized tags which were written in sometimes slightly different formats across datasets, using singular or plural forms of a same noun, including or excluding accents, and with or without capital letters. Additionally, we removed stop words like der or ein, which are superfluous to our analysis and distract from the content of the tags. Once these changes were made, we removed the tag Berlin. This is actually the most-used tag of all datasets, but it of course doesn’t provide us with any relevant information about a dataset – since we’re working with the Berlin Open Data Portal, it’s to be expected that all the datasets have something to do with Berlin.
Analyzing the tags
We analyzed the tags by creating bigrams off all co-occurring tags – i.e., which tags are used with which other tags in the same dataset, and how often this happens. This resulted in 22,783 tag bigrams whose occurrence distribution is displayed below.
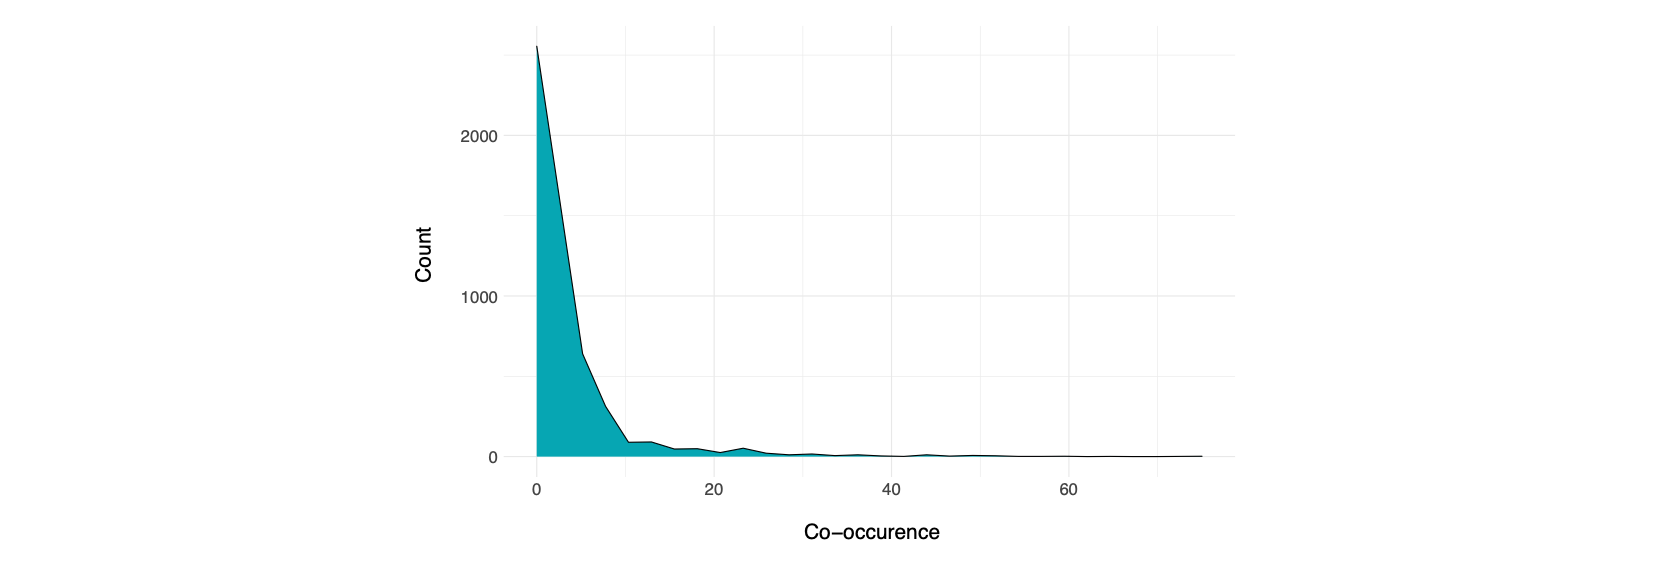
From these 22,783 tags, we conducted an analysis on a subset of the 342 most co-occuring tags (i.e. most frequent bigramms), for 138 tags in total. In this subset, the median tag occurrence is 13.5 (in contrast with 2 for the whole dataset), which means that most tag associations occur in 13-14 different datasets (as is the case for Kinder and Migrationshintergrund, for example), but the most co-occurring bigrams were present in up to 183 datasets (like for Geodaten and Karten).
Our next step was to conduct an automatic clustering analysis of all tags based on these bigrams. Using a Louvain community detection model, we measured which bigrams co-occured most often with which other bigrams, creating a network of bigrams separated across different themes. Using the most frequently used tags, this cluster analysis identified 13 different themes containing multiple bigrams which we then manually labeled. Indeed, community detection is helpful to indicate which bigrams occur with which other bigrams, but the software itself isn’t able to understand the underlying concept uniting terms like Preise and Werte. We therefore attributed labels using our understanding of the most common conceptual denominator behind these groups of tags.
Visualization
Using the information from our data analysis, we used the visNetwork function in R to create a network visualization of our dataset tags. This visualization includes a search option for tags and categories. Nodes, each of which represents a different tag, are weighted to represent its number of total occurrences across all datasets; the bigger the node, the most frequently it appears on the Berlin Open Data Portal. Edges, which are the lines uniting nodes, illustrate how often tags occur in the same dataset using our initial bigram analysis. The graph is also interactive: when clicking on one of the nodes or edges, the associated tag(s) and their category and occurrence appear.
In summary, our tag analysis provides an interesting insight into the diversity, frequency, and coherence of the topics covered by the datasets in the Berlin Dataportal. Tags remain an important tool for describing data and making it more discoverable. Of course, the graph cannot show all the connections, as only the most frequent tags and connections have been included.