HOW TO: Downloads from the geospatial data portal FIS-Broker
Download and process data with QGIS
The FIS-Broker is a real treasure trove for open geodata from Berlin. It is not easy to use though, especially not for beginners. At ODIS, we get regular requests from people who wonder how to access all these beautiful datasets. In the following post, our geodata expert Alexandra Kapp offers a quick guide on how to download Berlin’s geospatial data for your own purposes. Have fun exploring!
The FIS-Broker is Berlin’s geospatial data portal. All publicly available, spatially-oriented datasets are published here, e.g. bicycle lanes, school locations or living and green spaces. The data is visualized with maps and corresponding information is provided as a table. However, often there is the need to further process the data (for example, to filter it to only specific regions or data of interest), or maybe you want to combine the spatial data with other types of data. Unfortunately, it isn’t possible simply click a button and obtain a GeoJson or CSV file via the FIS-Broker (something many would-be users of the data look for and are confused when they can’t find it). Instead, the FIS-Broker provides a URL for a WFS server. The following article provides instructions on how to download the data via the WFS server URL, allowing users to convert the data into more familiar data formats for further use.
Data download with QGIS
There are various possibilities to download data from a WMS/WFS server. Programmers can use this Python Package from the OK Labs Berlin or this R Code. For non-coders we recommend using the open source software QGIS, which can be downloaded here free of charge. Subsequently, the data can be used for creating custom maps in QGIS, or it can be exported as GeoJson, shapefile, GML or CSV.
Step by step instructions:
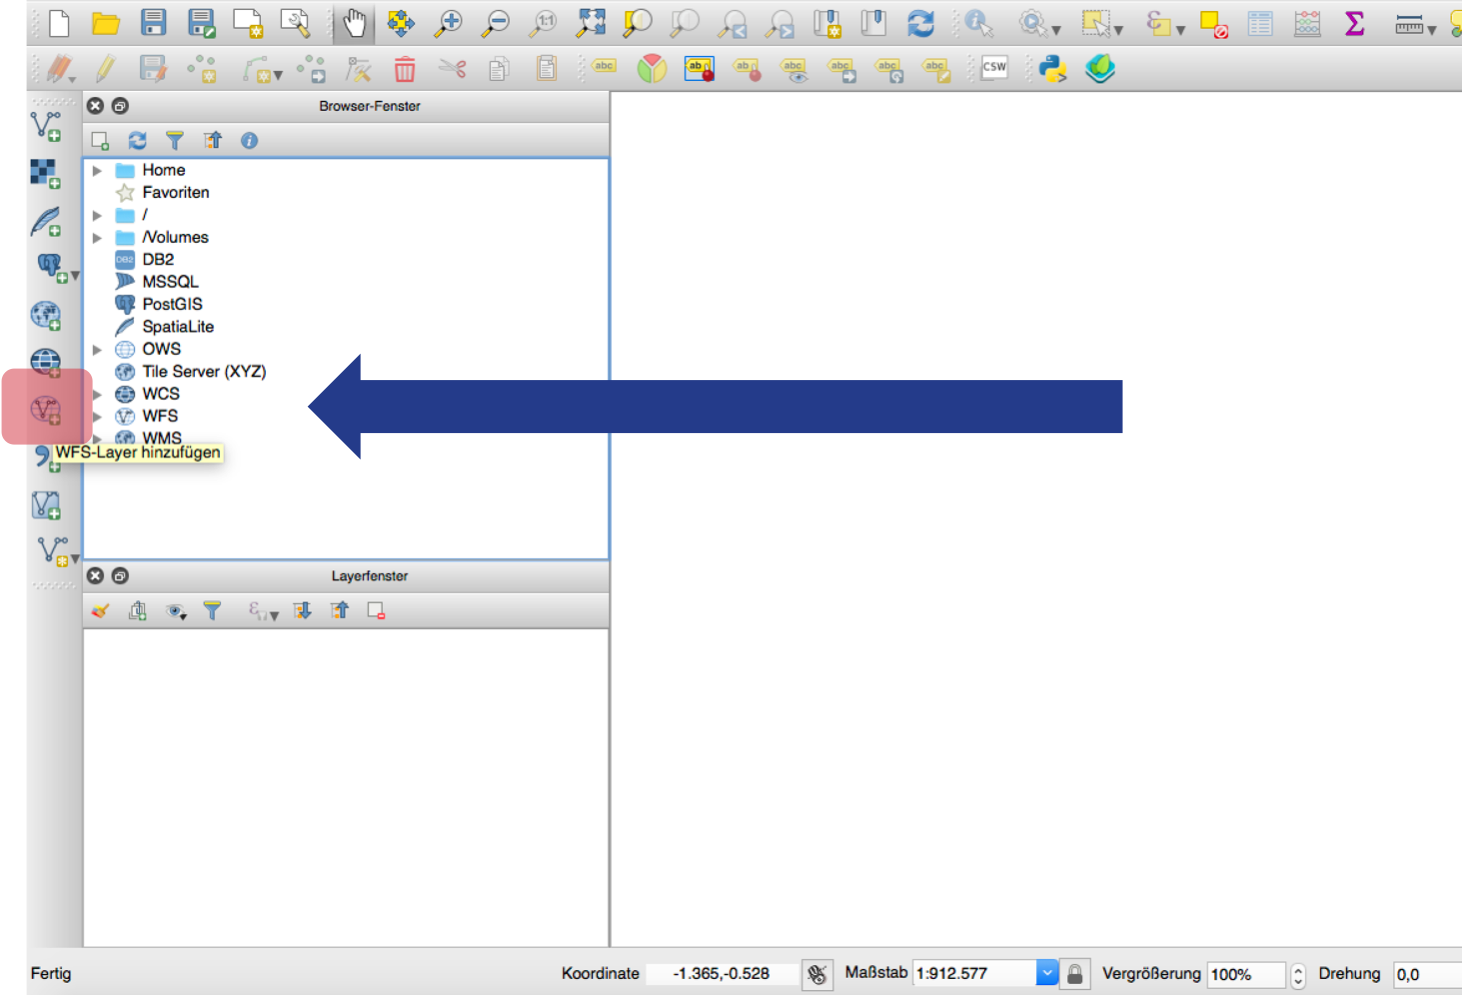
In QGIS, select “Layer > Add Layer” and click on “Add WFS-Layer” or select the icon in the left menu bar.
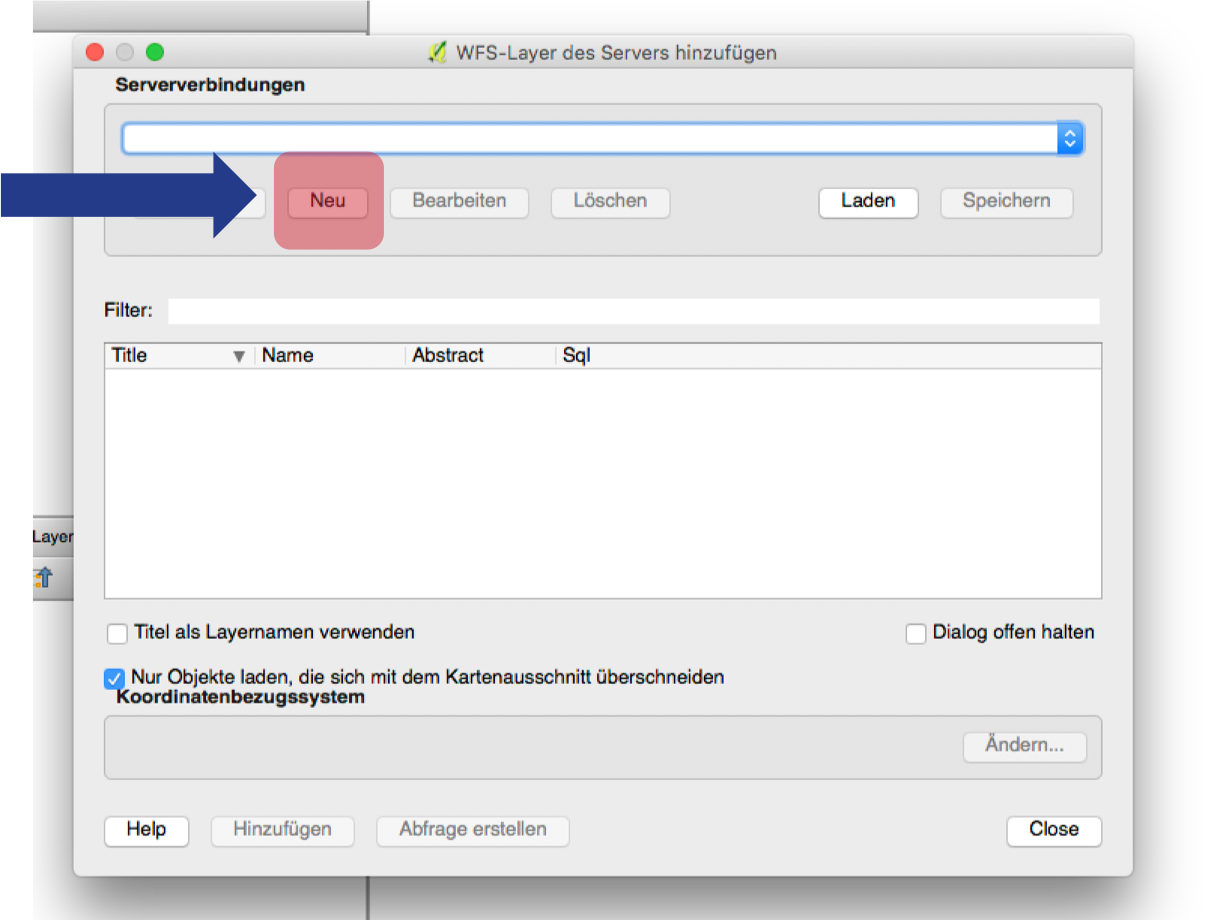
A new window with the existing sever connections will open. Create a new server connection.
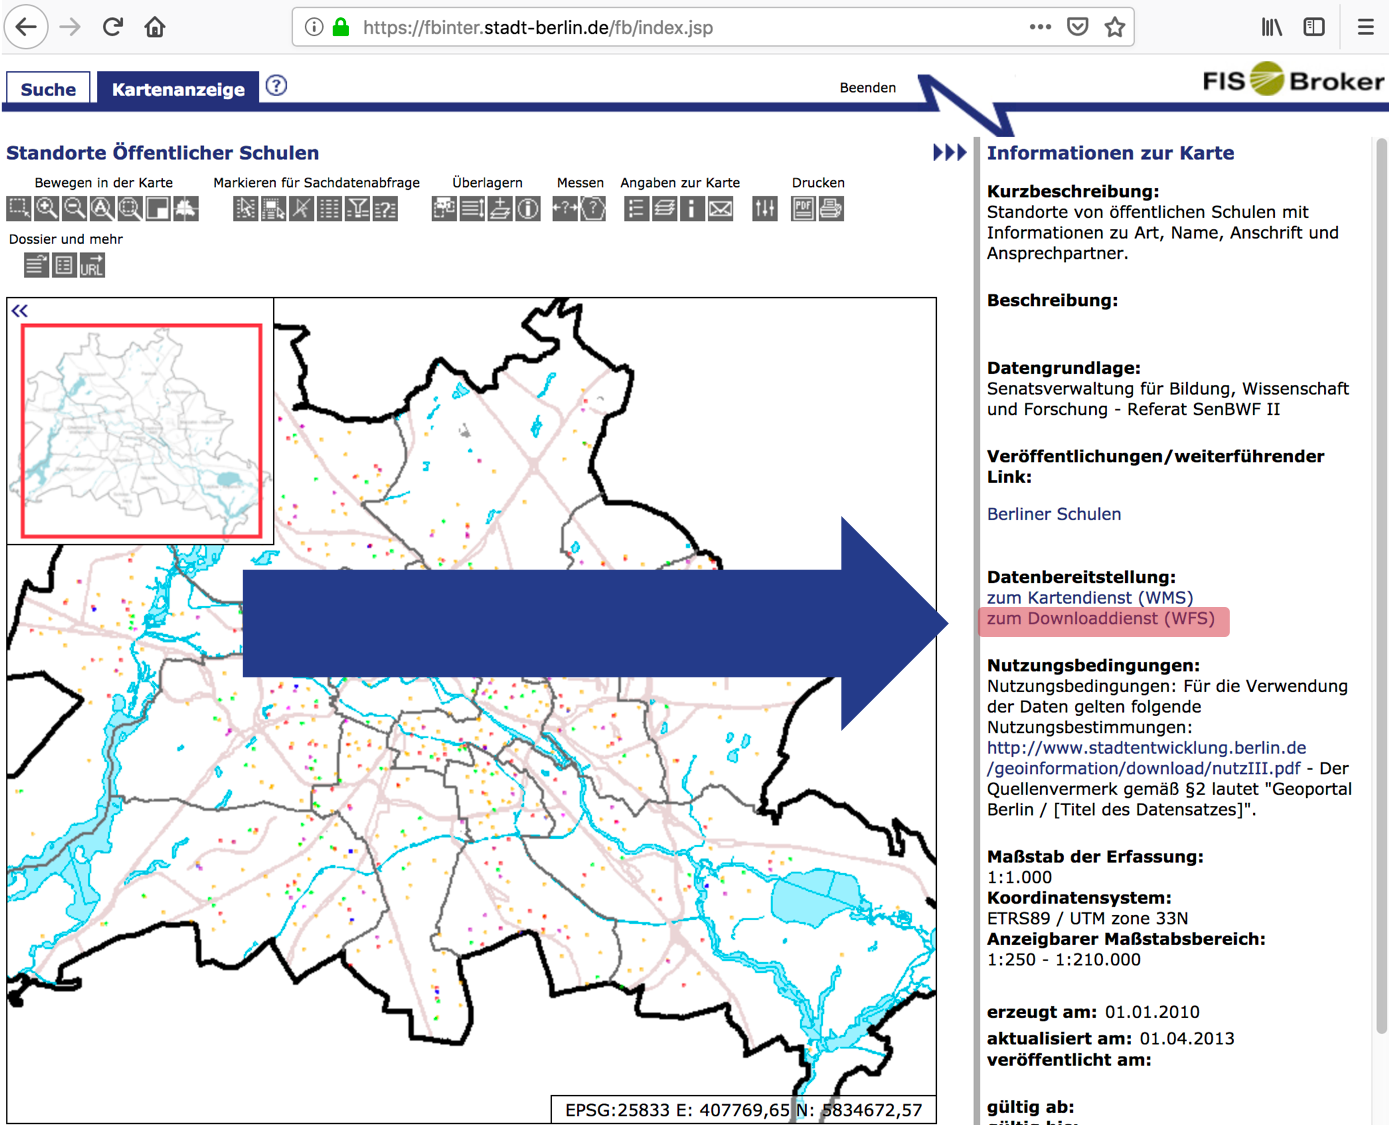
A new window will open that asks for the server URL. Search within the FIS-Broker for the desired dataset. In this example, we’re using a dataset of school locations. In the right-hand menu bar of the FIS-Broker, below the heading “Datenbereitstellung”, click on “zum Downloaddienst (WFS)”. It is important to select the WFS Link because the WMS Link only leads to a raster graphic without vector data or additional attributes.
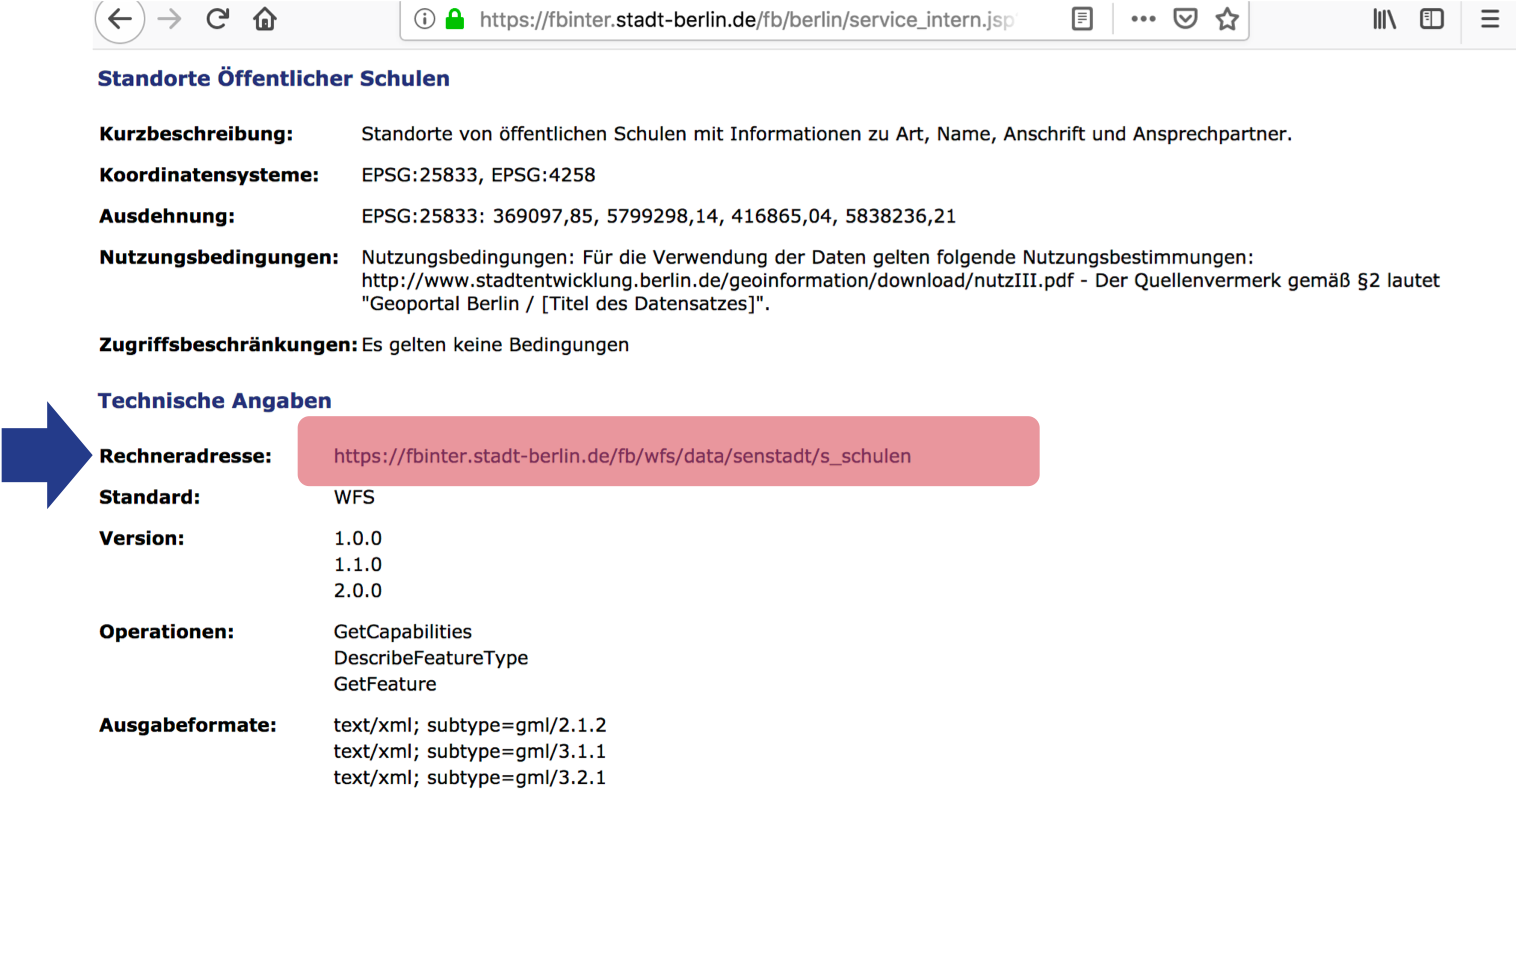
Clicking this link opens a new window with the information about the WFS server. We need the URL located at “Rechneradresse”.
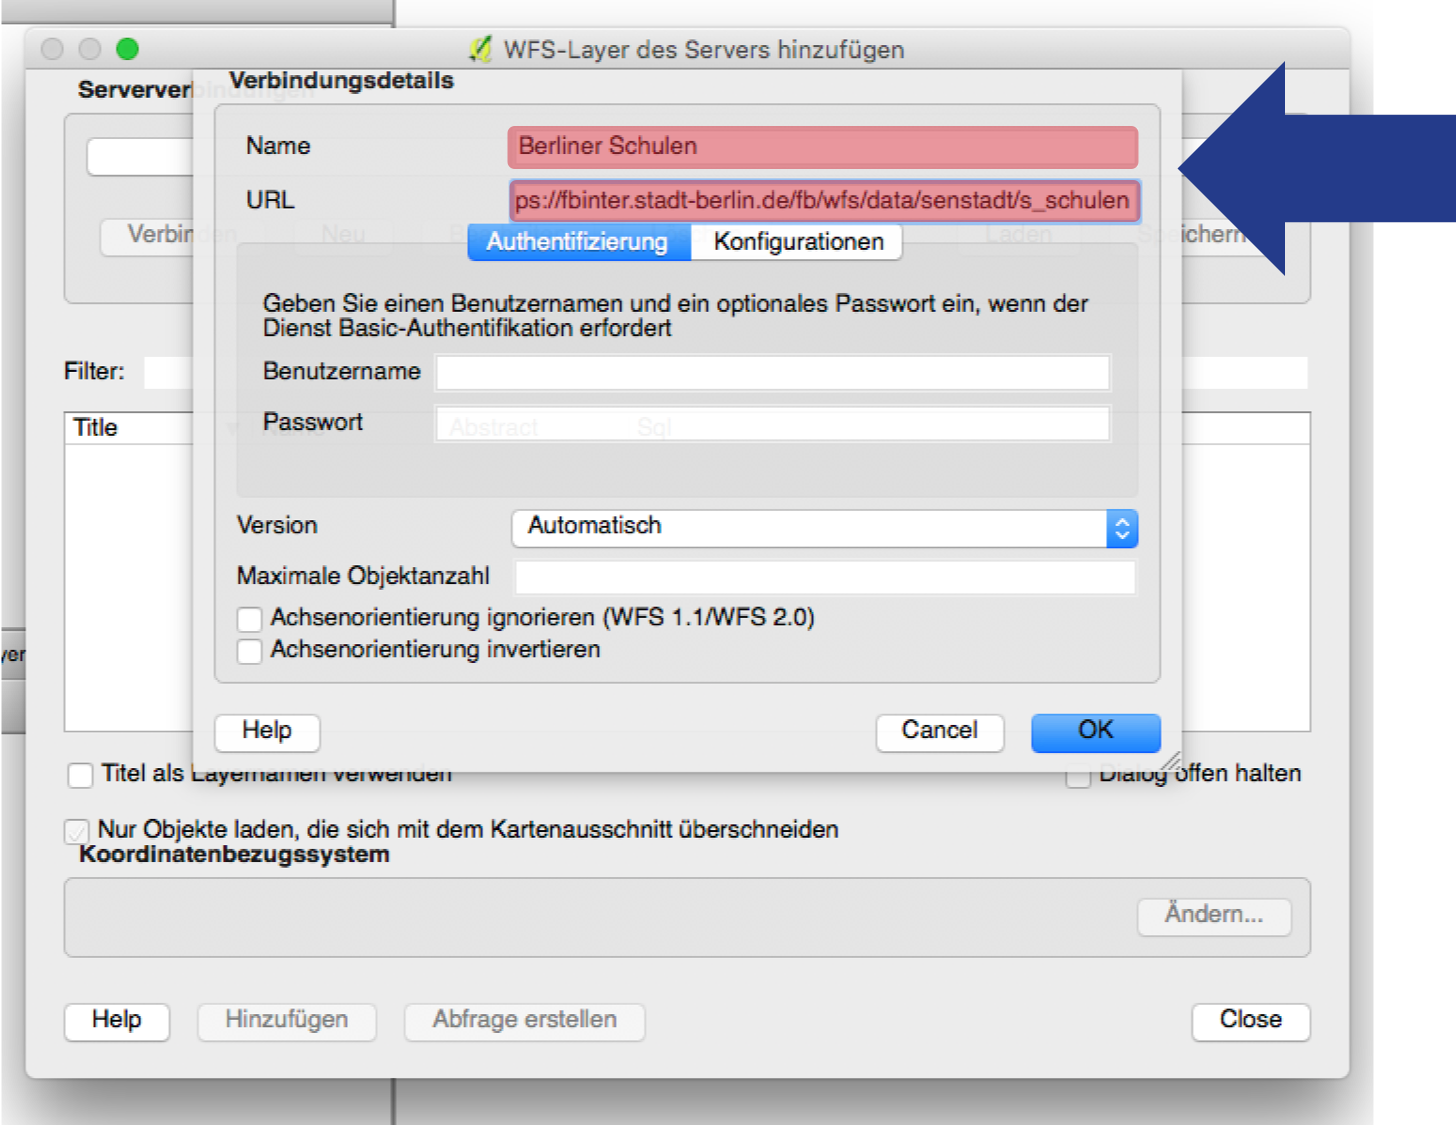
Copy the “Rechneradresse” into the URL field of the previously opened window “Connection Details” in QGIS. The name can be chosen arbitrarily, and the other fields can remain empty. Then, confirm with “OK”.
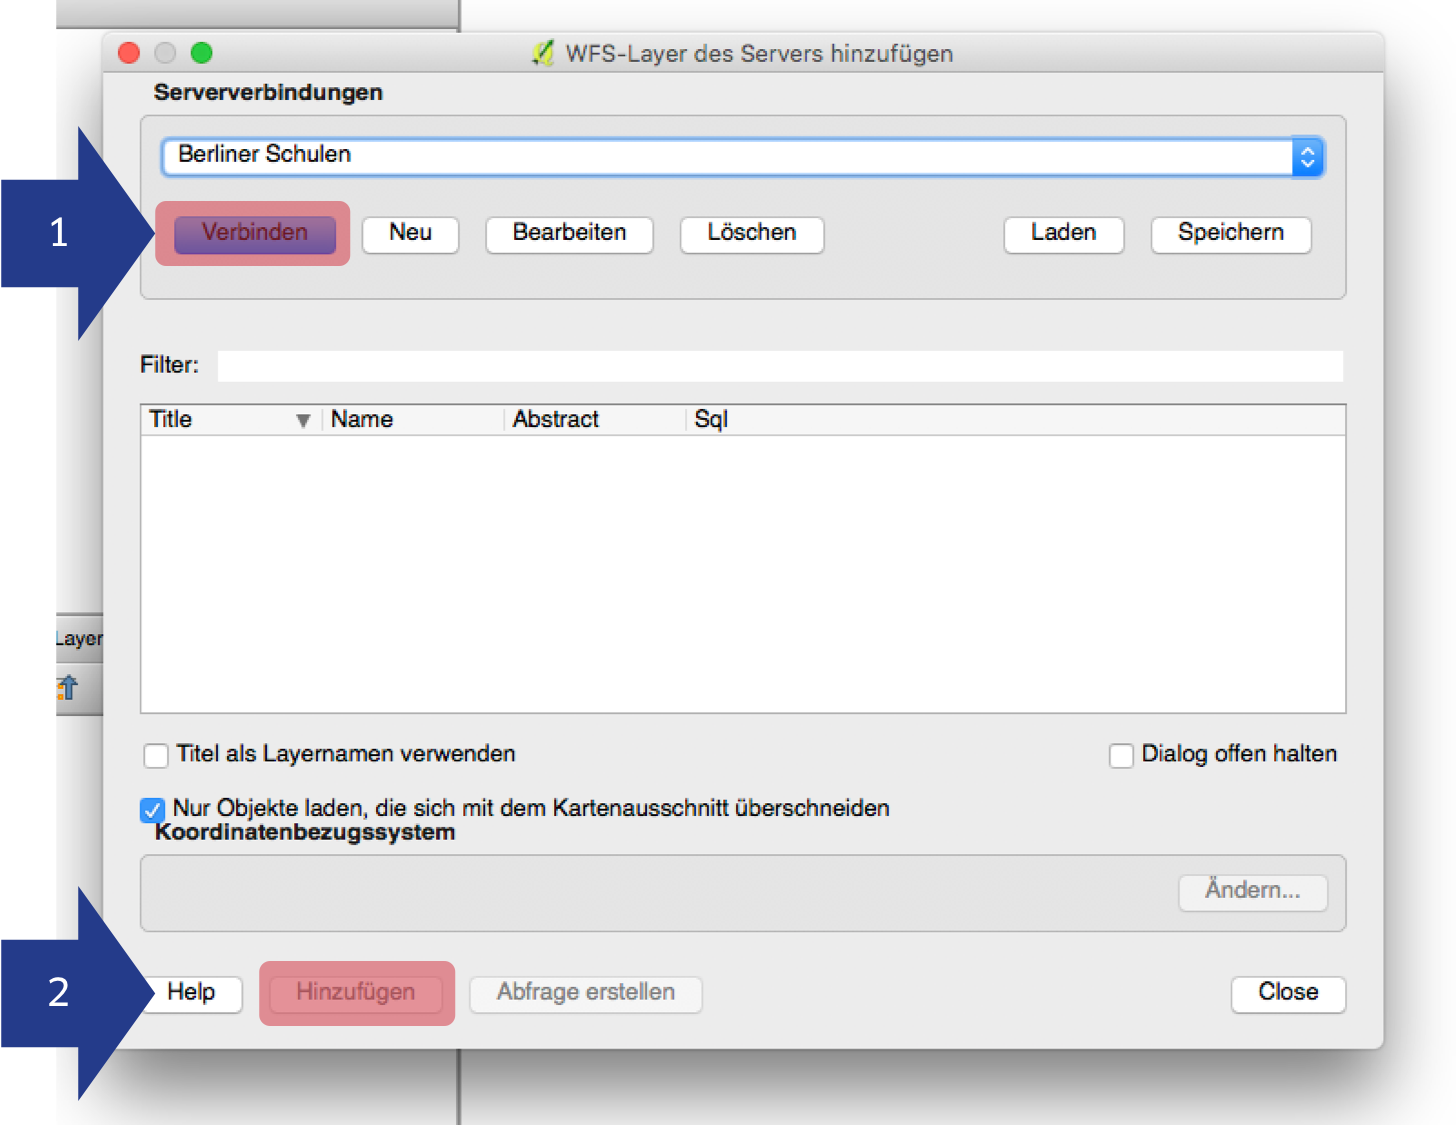
Click on “Connect” to connect to the server. The name of the dataset should appear in the table below. Add the data with a button click on “Add”.
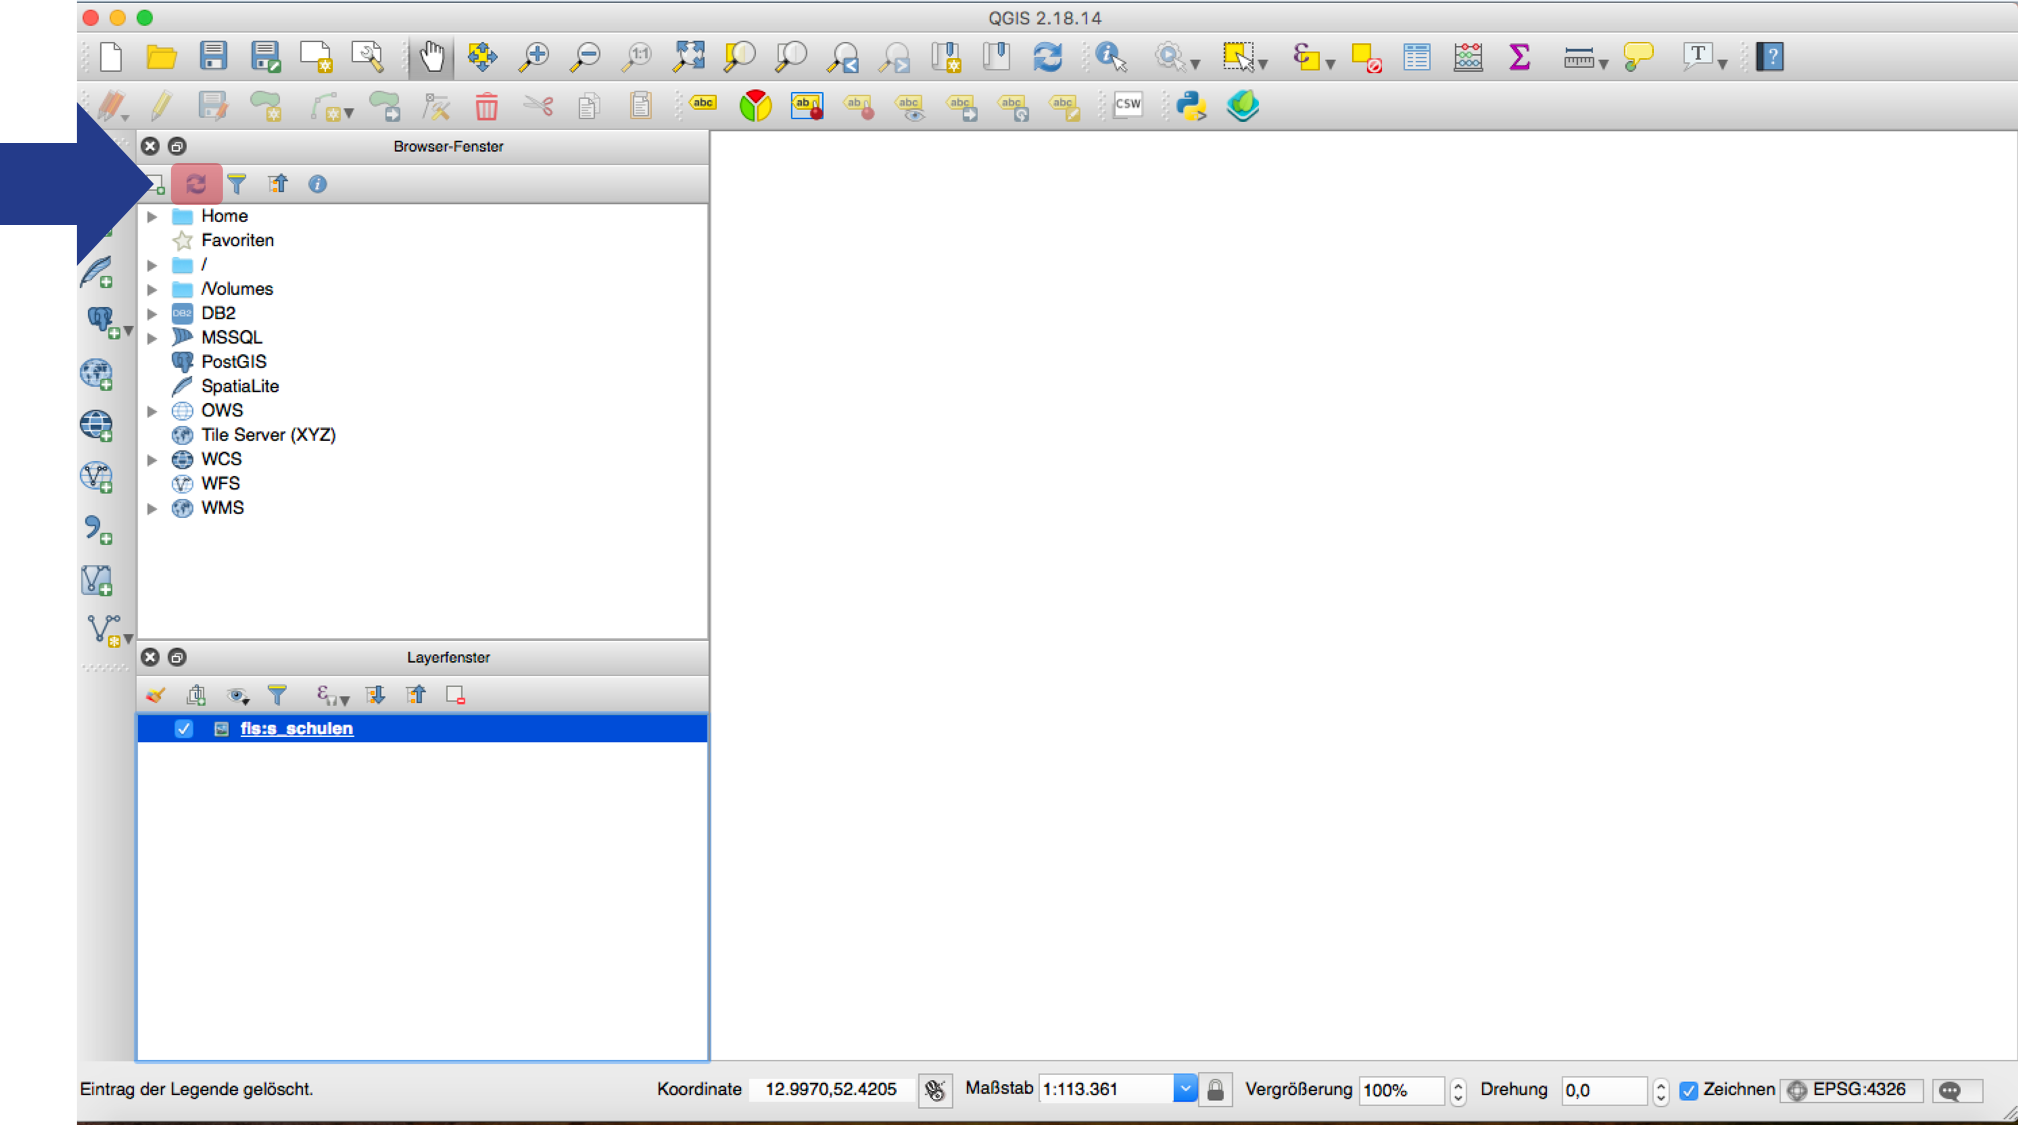
In case the dataset is not shown, “refresh” the browser panel by clicking on the arrow symbol.
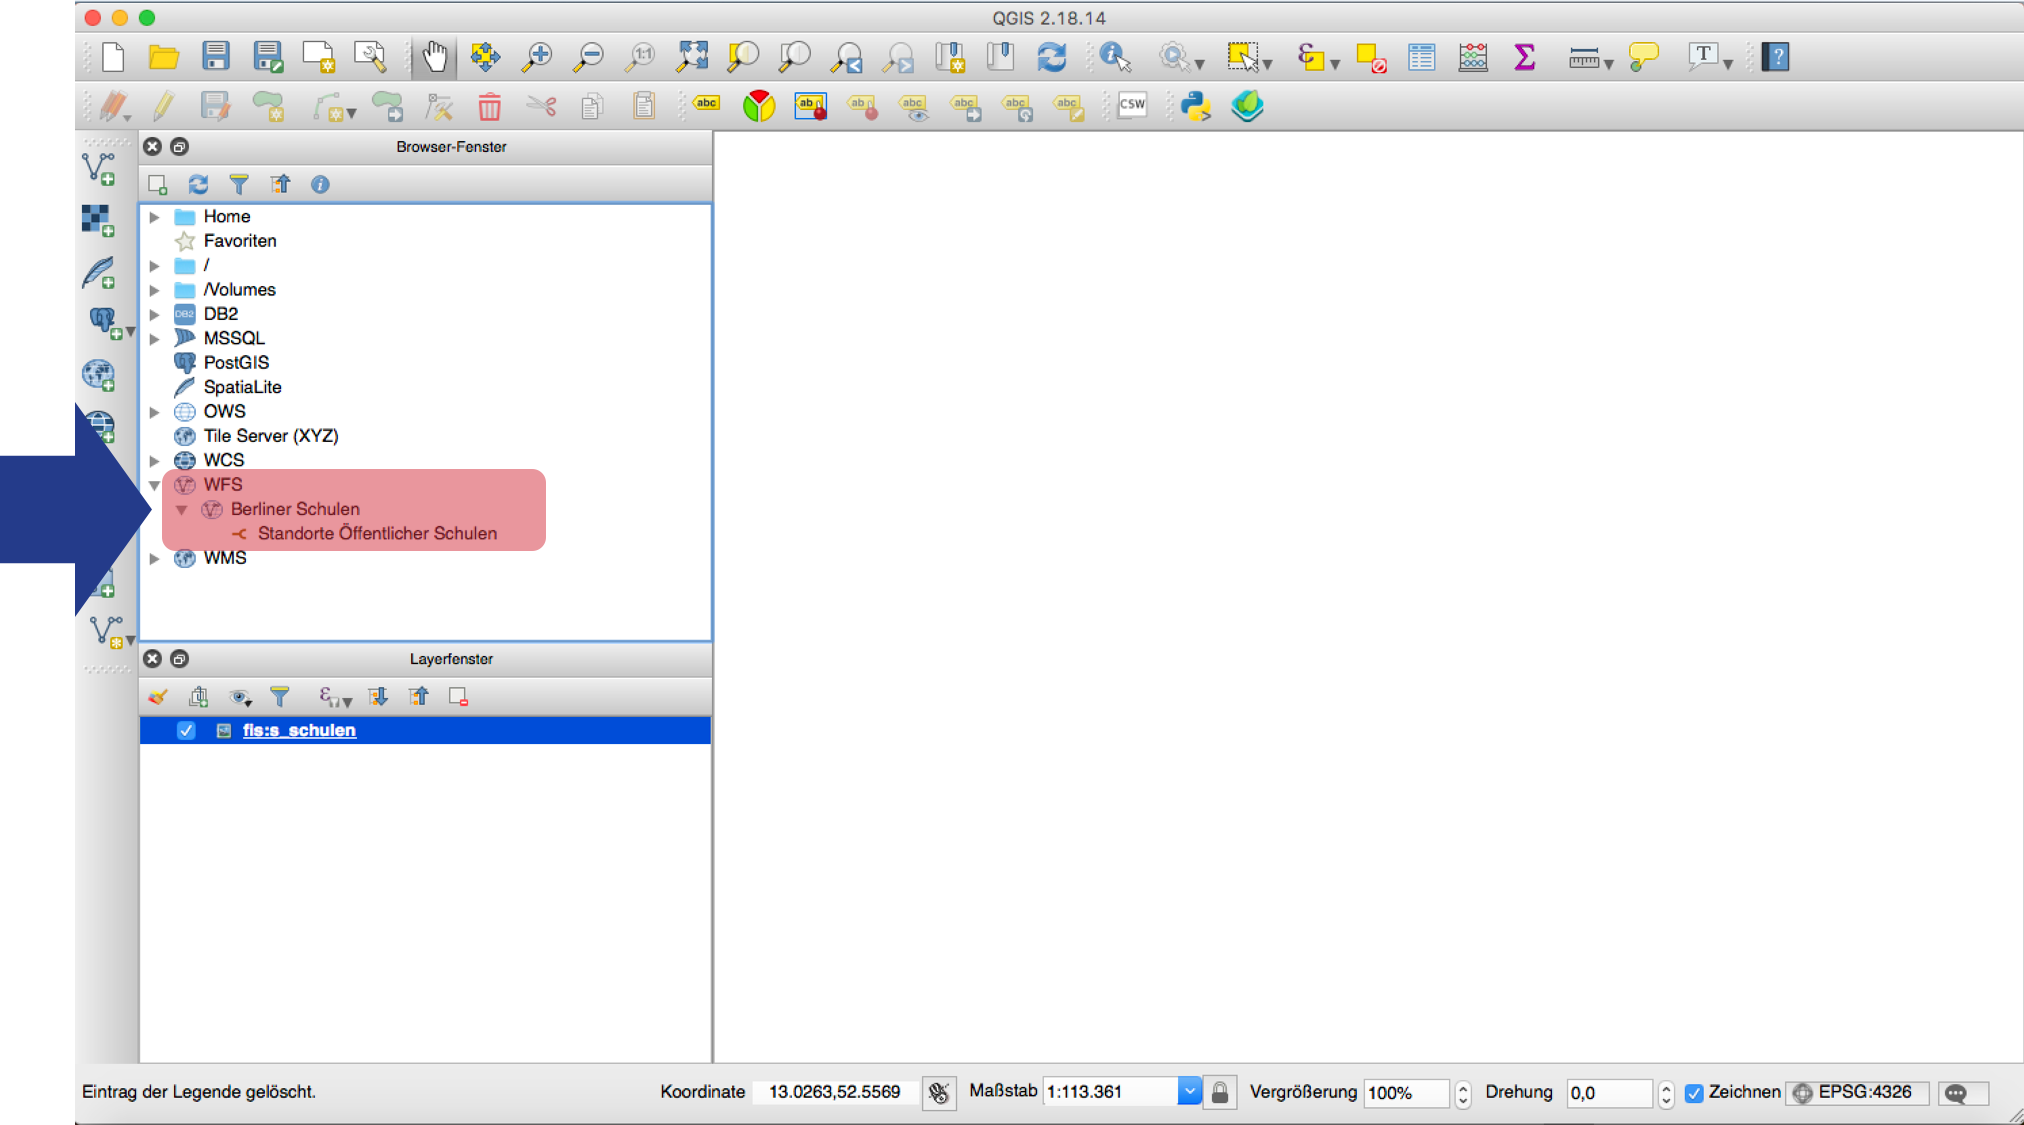
The layer of the dataset should now be visible in the browser panel within the “WFS” tab.
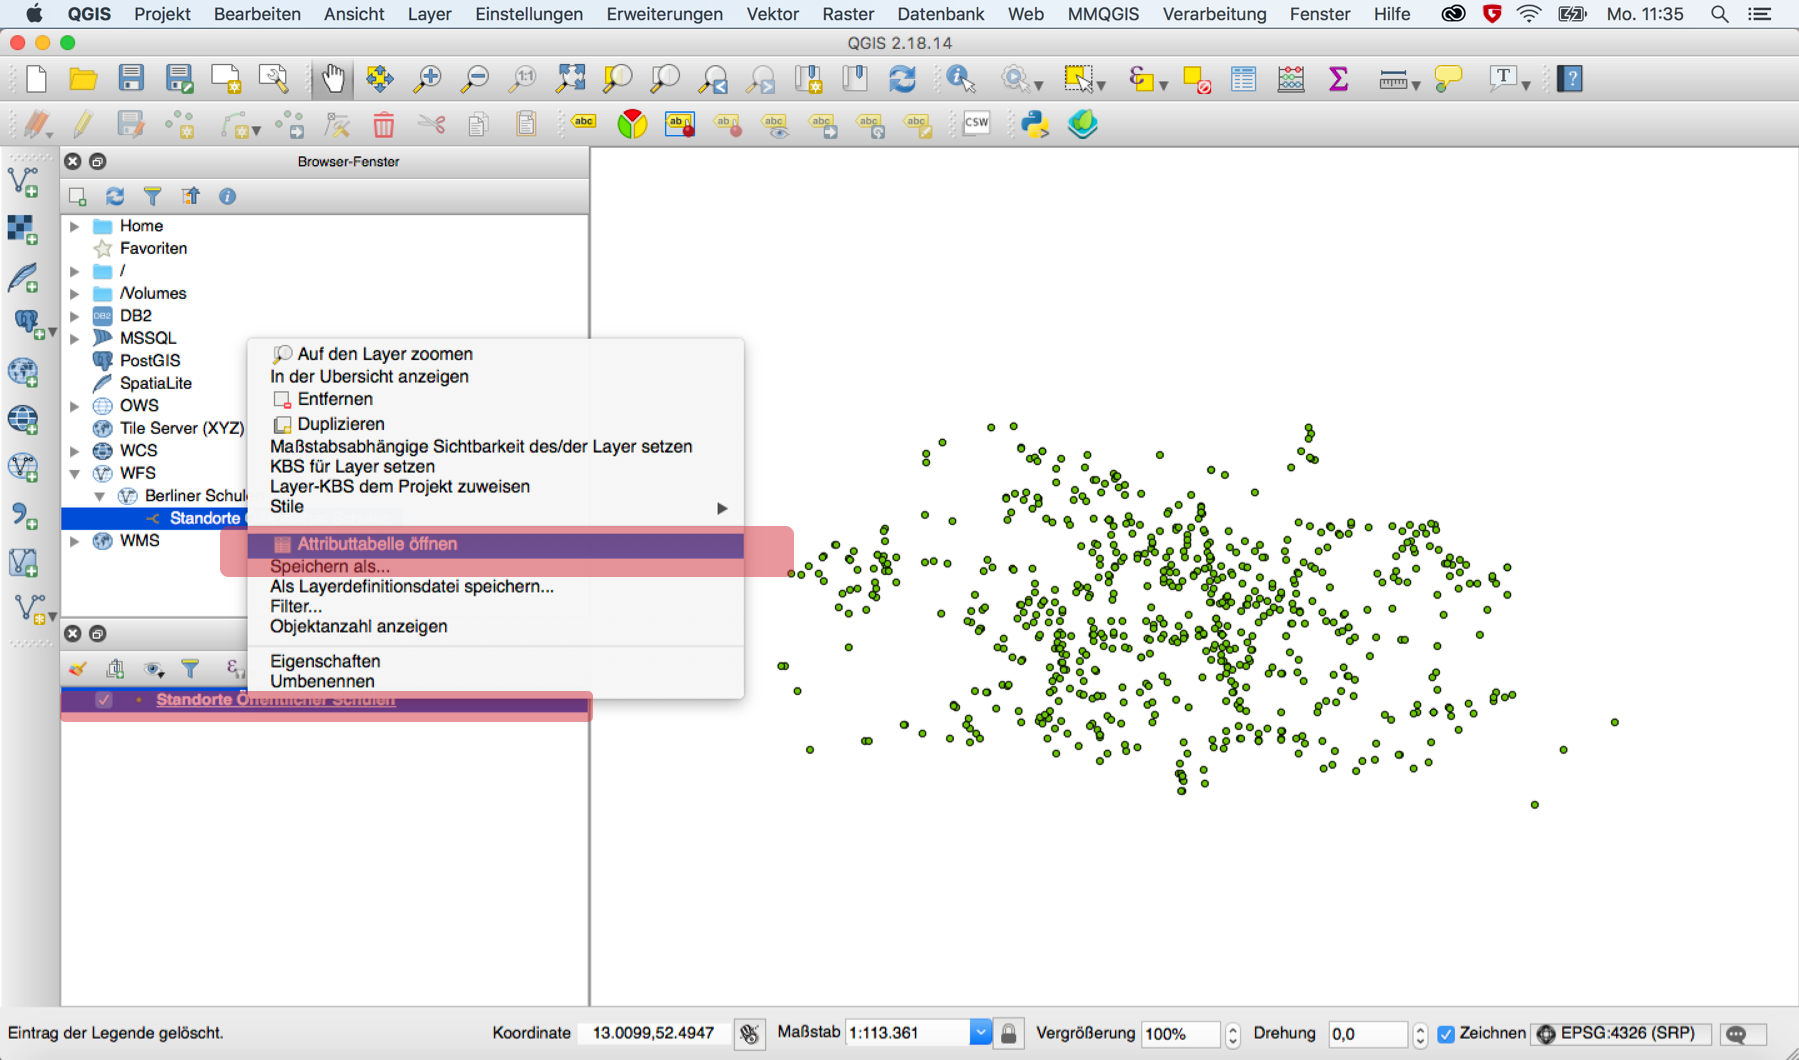
With a double click or drag and drop of the dataset into the Layer Panel the data should appear in the map view. In this example we can now see all schools in Berlin. QGIS offers various options to edit or enhance the appearance of your map. For example, a map can be laid underneath the existing map, the visualization of the data points can be edited, or another layer can be added (e.g., the district borders). For a more detailed guide on what you can do with QGIS, Sebastian Meier (member of the Ideation & Prototyping Lab team) created an elaborate QGIS introductory guide (available only in German) that can be downloaded for free.
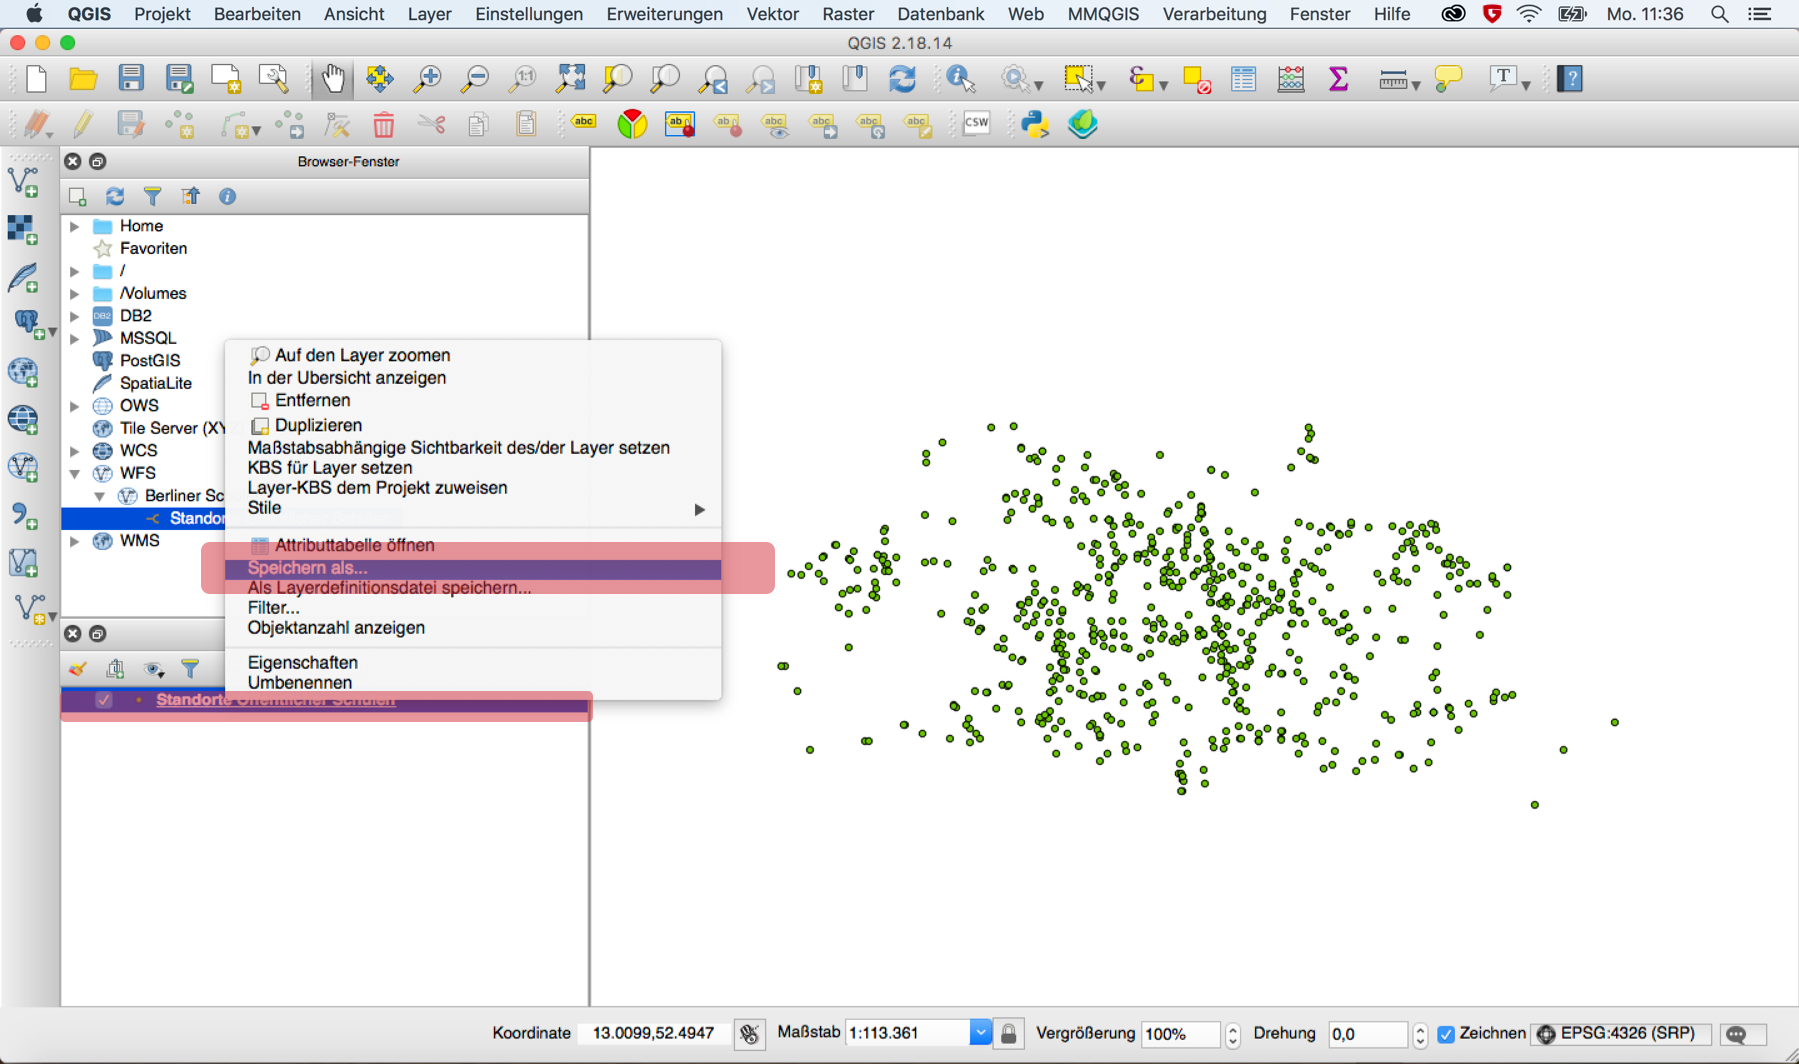
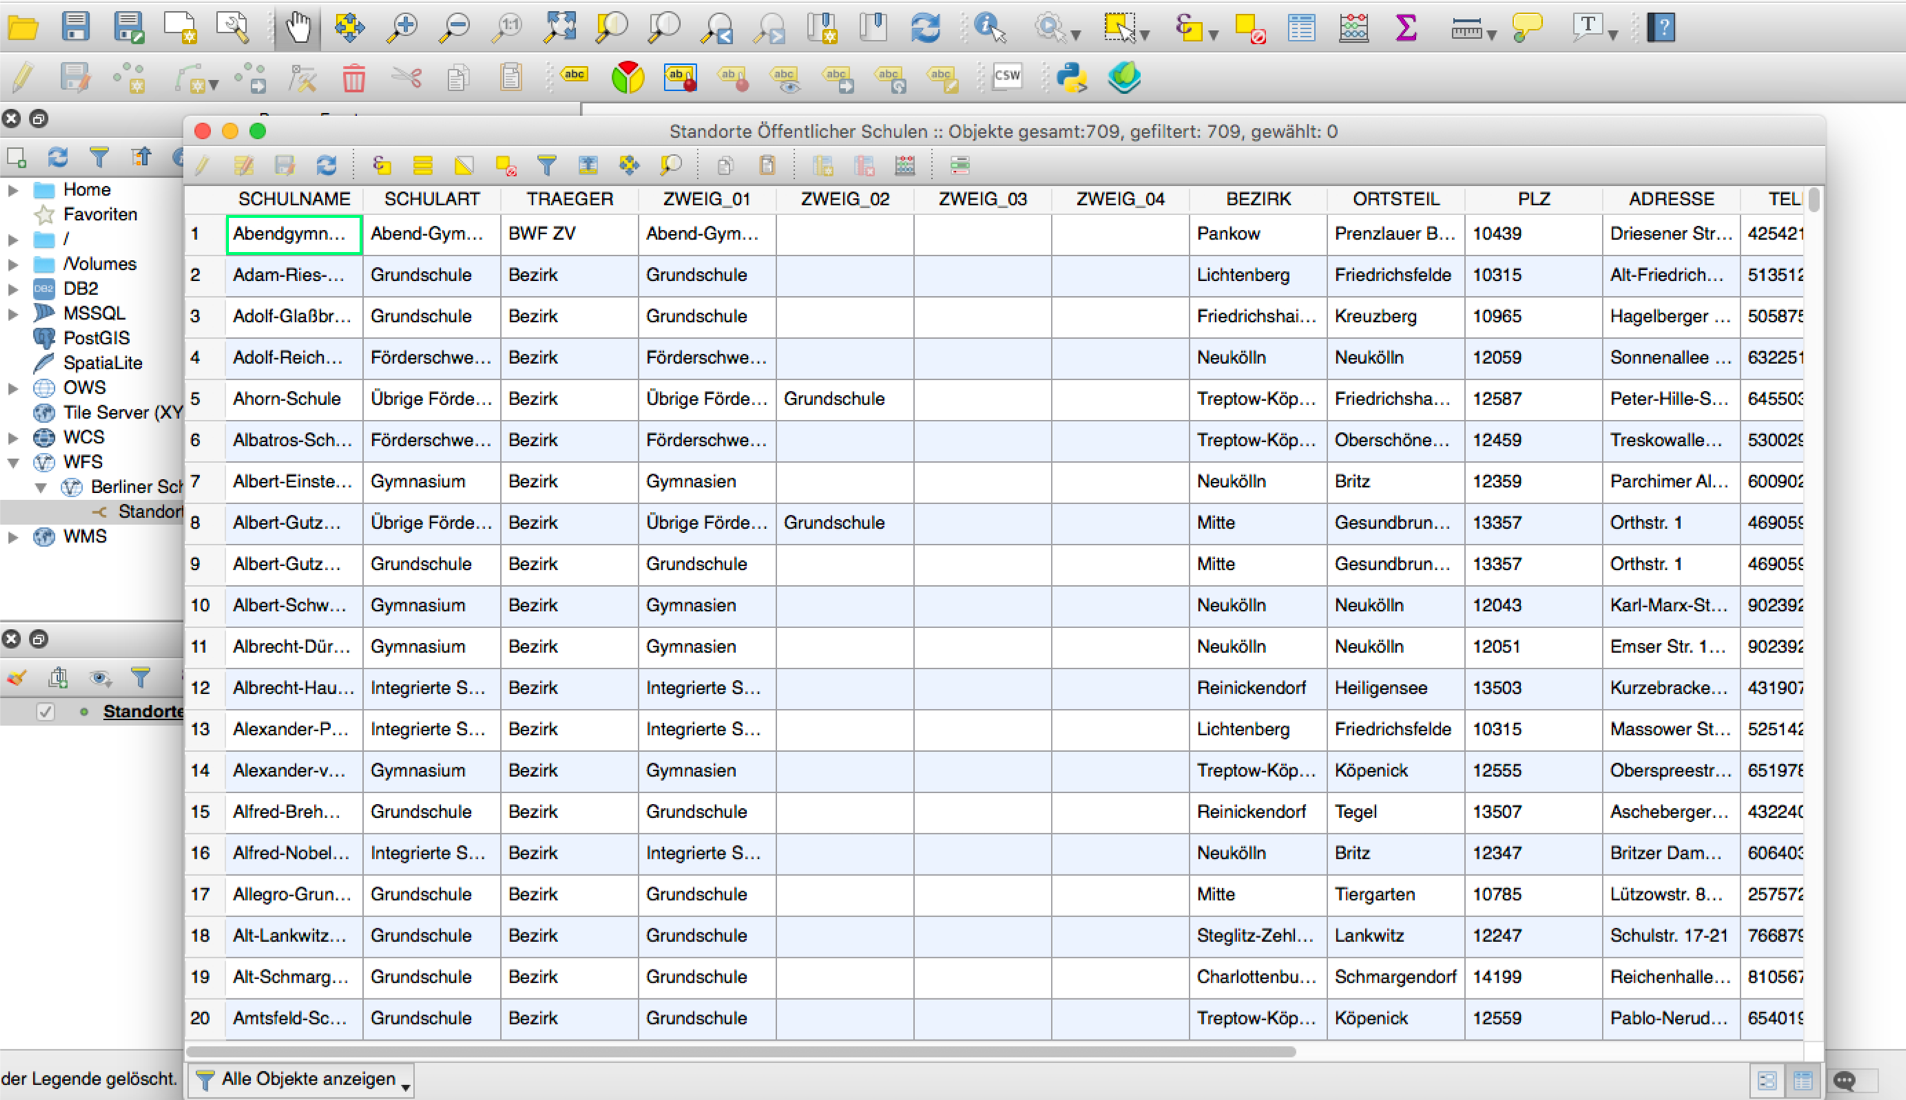
The attributes of the data can be viewed directly in QGIS by right clicking on the Layer and selecting “Open Attribute Table”.
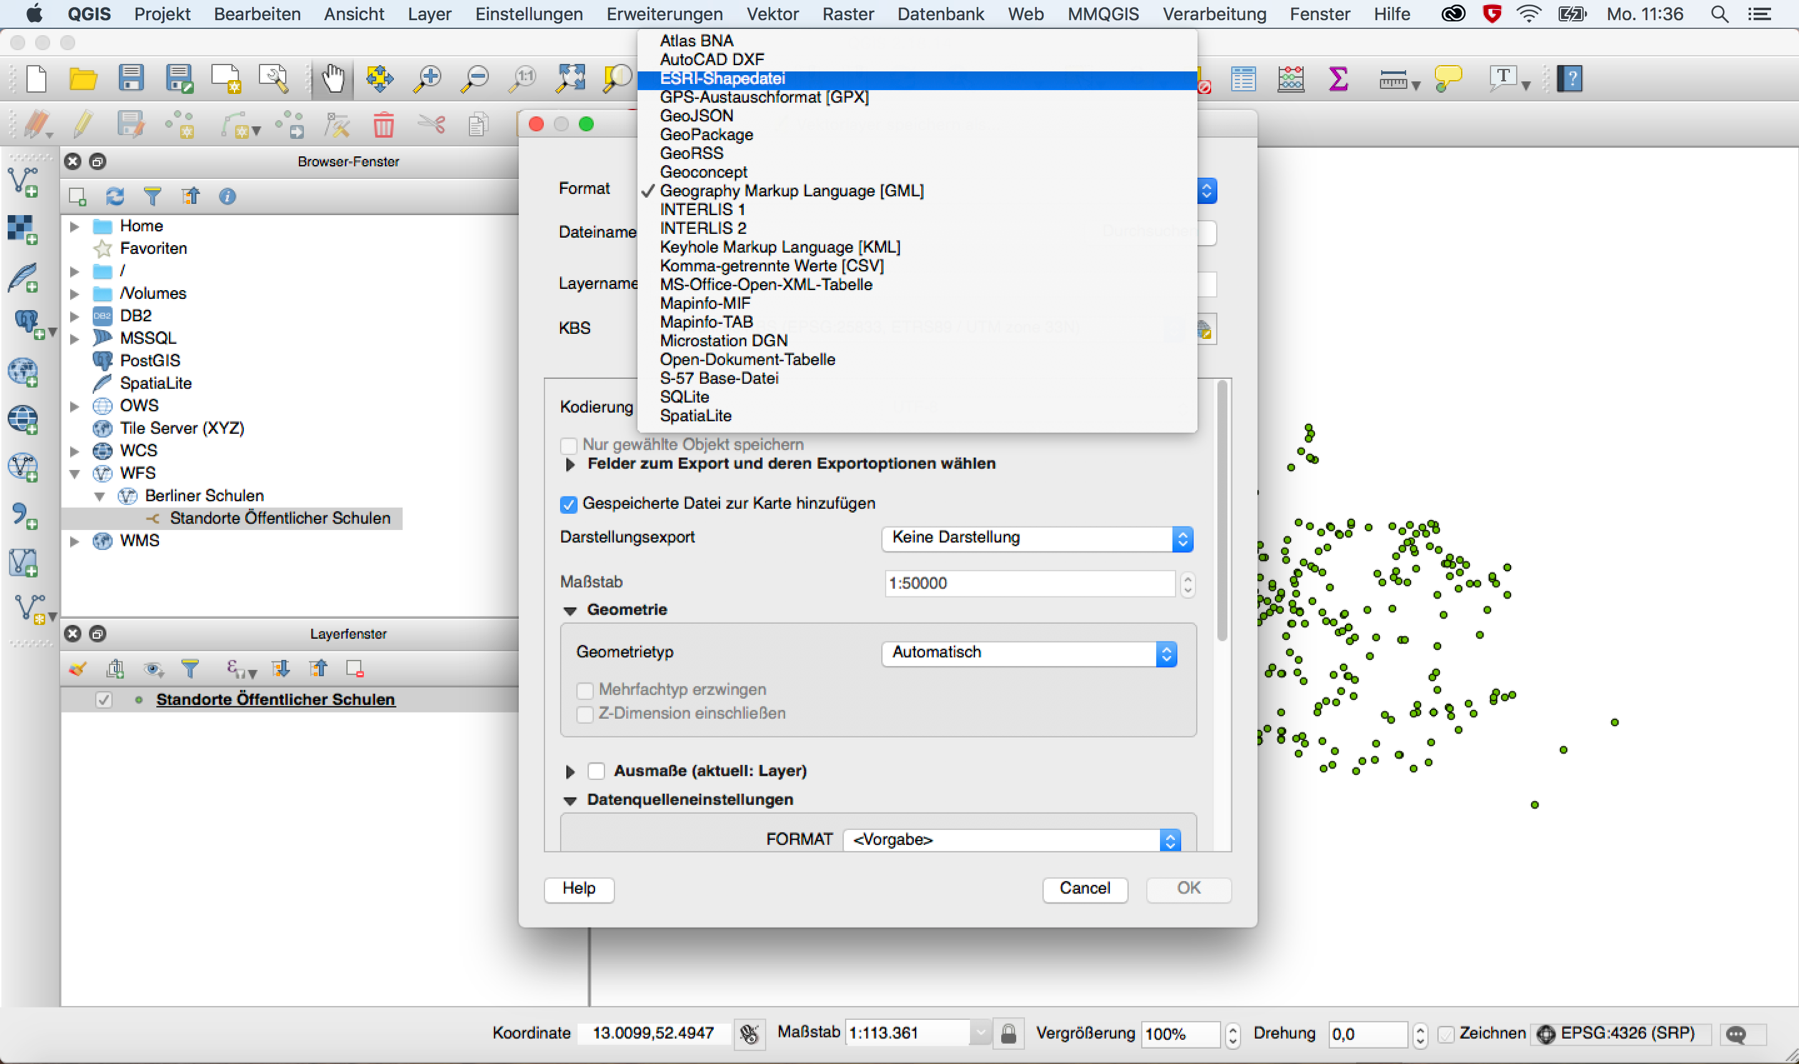
With a right click on the layer and selecting “Save as …”, the data can be saved in various other formats (shapefile, GeoJson, GML, CSV, etc.).