Data Dive: Cycling data in Berlin
What data is available?
Introducing: Data dives
This piece represents the first of (hopefully) many “data dives” conducted by the Technologiestiftung as part of its work with ODIS. A data dive is an in-depth look at a topic that is of widespread interest in Berlin from a data-centered perspective. In these pieces, we want to assess two main questions: first, what types of data are useful or even essential to forming a comprehensive understanding of this topic? Second, what is the availability of this data – i.e., is this data currently available as open data, as non-machine readable or as closed data, or is it not even known whether the data exists somewhere? These data dives serve the simultaneous purpose of making existing data resources easier to find by listing them in a single location, while also highlighting areas where there is a clear need for more and better data.
Diving into bicycle-related data
To begin this series, we have decided to look at the subject of bicycle-related data. This has always been a popular topic in Berlin, where demand for more and improved bike infrastructure continues to mount. Most recently, a “mobility law” (Mobilitätsgesetz) was passed at the end of June of this year; it included specific provisions for how bicycle infrastructure should be expanded in the city.
In the below sections, we list the key datasets needed to form a comprehensive overview of what the status quo of cycling in Berlin is. One general note: several of the datasets below exist in the FIS-Broker, Berlin’s main repository for geospatial data. In theory most data in the FIS-Broker is open data that can be downloaded and reused via a WFS server; in practice, the platform is extremely challenging and unintuitive to use and extracting data out of it is not trivial. To better enable the re-use of this open data, the Technologiestiftung Lab has extracted some of the core geospatial datasets mentioned here and made them available via our data portal in a variety of common data formats (e.g., GeoJSON, KML, etc.) The Lab is also working on tools to make it easier for FIS-Broker data to be extracted and used.
If you notice information here that seems to be incorrect, or if you are aware of relevant data sources that we did not identify, please feel free to reach out to boeck@technologiestiftung-berlin.de with corrections or suggested updates.
Bike infrastructure data
Bike lanes – existing
Status: Open data available
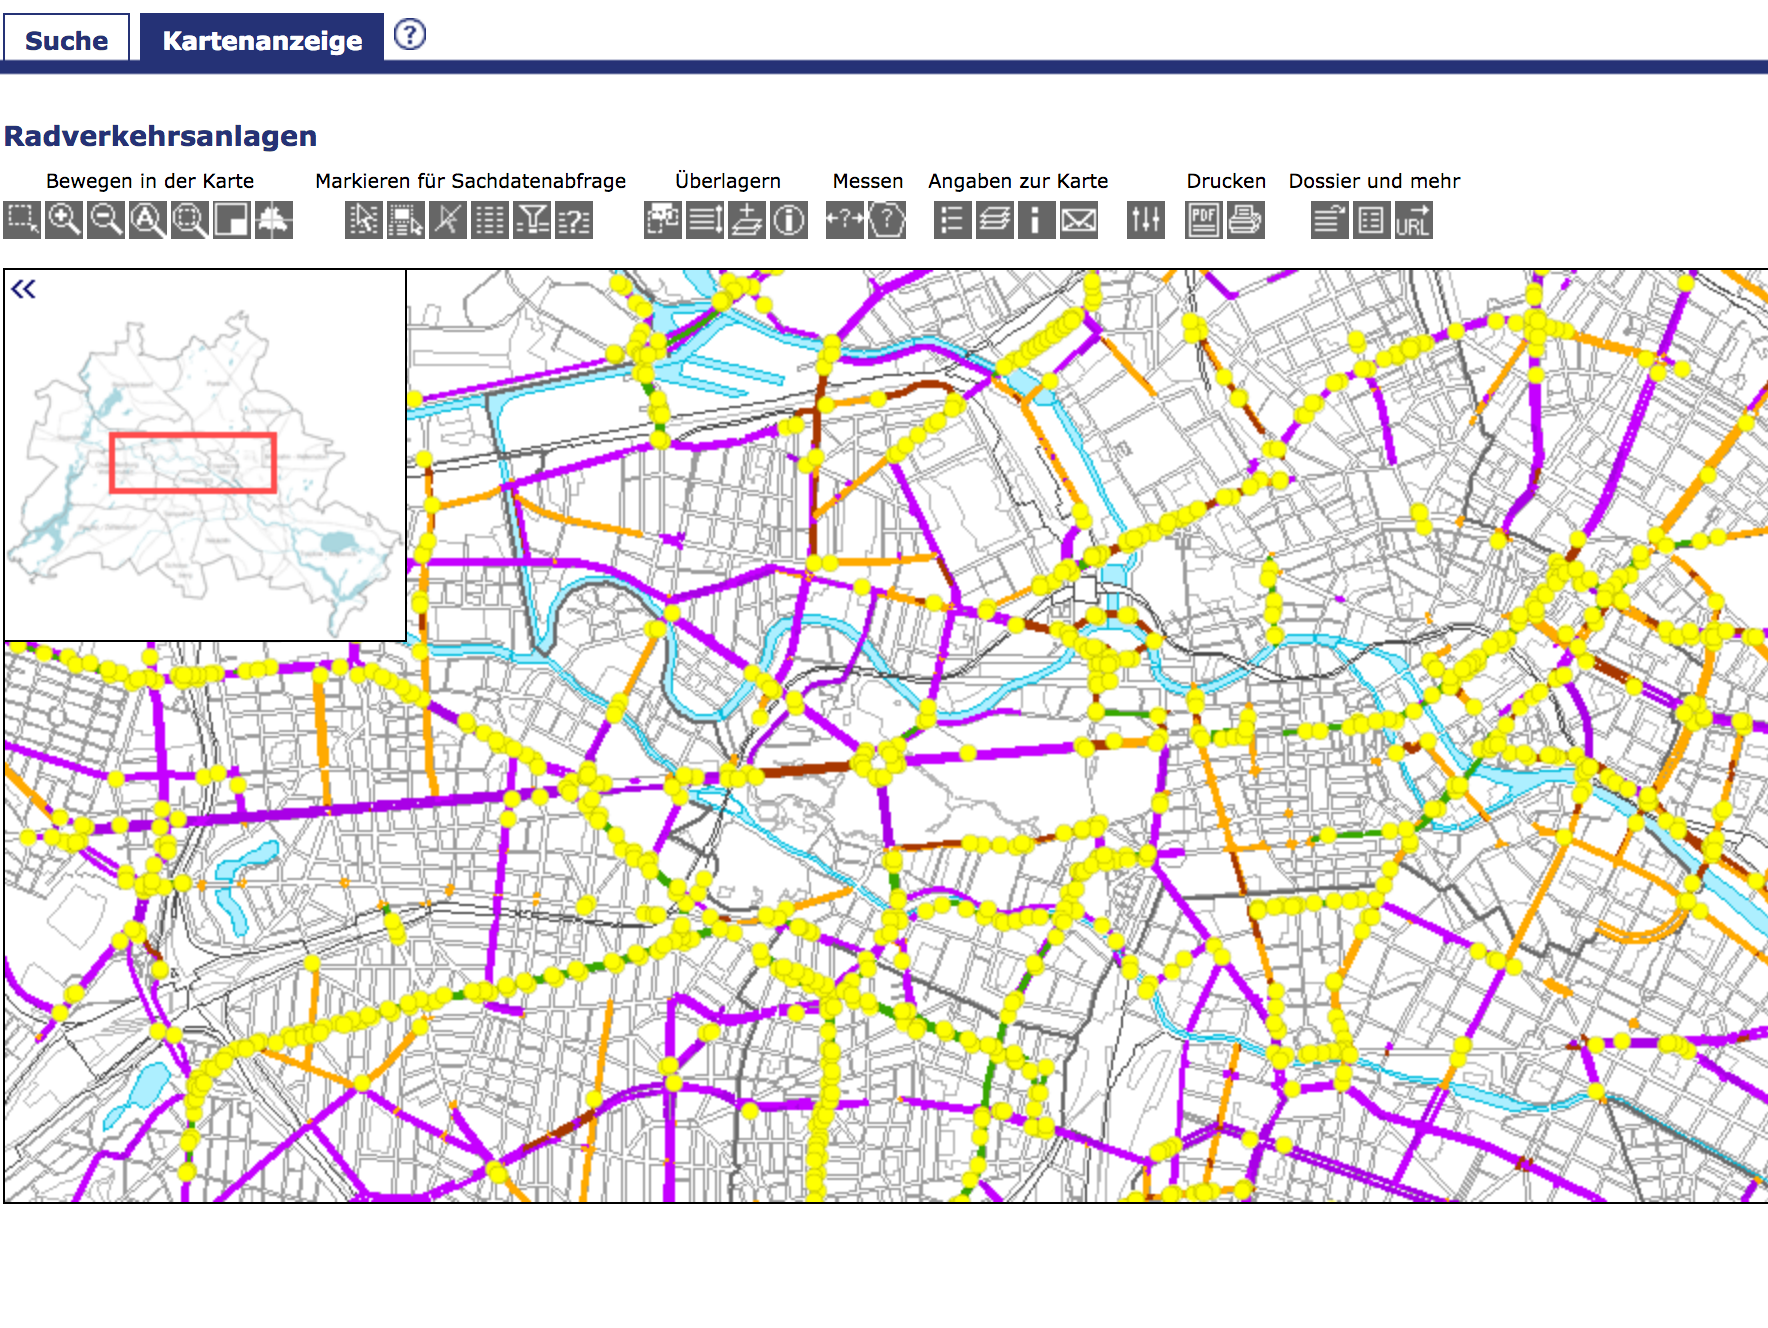
Geospatial data for existing bike lanes can be found via the FIS-Broker. The current map was last updated in April 2017; no information is provided as to how regularly it is updated. The map includes geospatial data for the locations of bike paths (Radwege), designated bike lanes (Radfahrstreifen), advisory bike lanes (Schutzstreifen), and bus lanes (Bussonderfahrstreifen).
- Map of existing bicycle infrastructure (FIS-Broker map)
- Geospatial data available for download via the Lab data portal
Bike lanes – planned
Status: Limited non-open data available
Unfortunately, information on planned construction projects related to bike infrastructure is much harder to acquire. A wide-ranging initiative to improve bike infrastructure across the city was announced in 2011, and there is a map in the FIS-Broker showing the extent of planned construction projects. However, it is difficult to find information on whether this project was completed as planned, or if some of these proposed construction projects have not yet come to fruition (the accompanying webpage simply says that the expanded network of bike routes should be acceptably usable and signposted by 2017, with no indication of whether this actually happened).
However, many bike infrastructure projects are not carried out by the central government but rather at the Bezirk (borough) level, specifically by each Bezirk’s “Straßen- und Grünflächenamt” (“Department for Streets and Green Spaces”). This means getting a complete picture of planned projects for all of Berlin often requires consulting each Bezirk individually. Further, no Bezirk currently publishes information on planned bike infrastructure projects as machine-readable data, meaning acquiring this information varies from skimming a relevant PDF to sifting through dense layers of webpages in search of the desired information. Several Bezirke, like Charlottenburg-Wilmersdorf, Friedrichshain-Kreuzberg, and Neukölln have either websites or PDF reports where they list planned construction projects. However, it’s always unclear what the exact status of these projects are and if they are actually being completed based on the planned schedule; in many cases, these pages or documents are years old. In short: gathering accurate information on planned improvements or additions to bike infrastructure is a painstaking process likely to require direct communication with individual Bezirke themselves to verify the accuracy or current status of information published online (if there even is any information online).
An additional source of information on planned bicycle infrastructure projects is budgetary allocations from the central government to the Bezirke to fund such initiatives. It is not the case, however, that all projects singled out as receiving funding in a budget line will actually come to fruition. Moreover the depth of information provided is quite minimal, meaning it would be difficult to form an accurate picture of where exactly in Berlin infrastructure improvements or additions are being planned, and what exactly the nature of these plans are (e.g., will something entirely new be constructed, or will existing routes simply be improved / repaired). A good resource for reviewing what kinds of budget allocations have been made for bicycle infrastructure is this parliamentary enquiry from March 2018, which includes a list of allocations for 2017 and 2018, broken up by the relevant budgetary chapter.
The Tagesspiegel recently attempted to gather information on all existing and planned bicycle lanes across the city and released their results as an interactive map, but even they acknowledge that there are many gaps and inaccuracies in their visualization as a result of inaccurate and outdated information provided by Bezirke.
Lastly and most recently, the project FixMyBerlin has premiered their online platform that (among other features) shows where in Berlin new bike routes are being planned. Their data is provided by the Bezirke themselves, so there still may be inaccuracies or incomplete entries depending on the quality of the Bezirk’s own data. Regardless, the site serves as a very useful resource for tracking what measures are currently being planned or built. Their data is currently being made available via an API.
- 2012 map of planned bike-related construction projects (FIS-Broker map)
- Parliamentary enquiry on budgetary allocations for planned bicycle infrastructure improvements
CSV files extracted from a March 2018 parliamentary enquiry listing planned bike infrastructure improvements according to the relevant budgetary title & chapter:
- Chapter 0730, Title 52108 (2017)
7 KB, extracted 08/2018 - Chapter 0730, Title 52108 (2018-19)
6 KB, 08/2018 - Chapter 0730, Title 72016 (2017)
3 KB, 08/2018 - Chapter 0730, Title 72016 (2018-19)
3 KB, 08/2018
Express bike lanes
Status: Limited non-open data available
Express bike lanes (in German: “Radschnellwege”) represent a specific category of bike infrastructure: these are bike lanes that are designed to provide riders with as efficient a route as possible by offering a lane almost completely isolated from auto or pedestrian traffic that also has minimal stops. The Senatsverwaltung for Environment, Transport and Climate Protection has announced its plans to develop several such pathways around the city. Plans have currently only been released as text descriptions and PDF maps, however.
General road infrastructure data
Berlin’s street network
Status: Open data available
Naturally, when mapping bicycle infrastructure, it’s relevant to also have an oversight of streets in general, regardless of whether they feature special additions for bike riders. There are two main, similar spatial datasets available on the FIS Broker for the street network in Berlin. One is the Overall Existing Street Network (Übergeordnetes Straßennetz Berlin), which highlights and categorizes all major streets in Berlin. The second is the Detailed Network (Detailnetz Berlin), which includes all streets, major and minor, as well as features like tunnels and bridges. Both maps are updated regularly (most recently in 2017).
Road construction
Status: Limited non-open data available
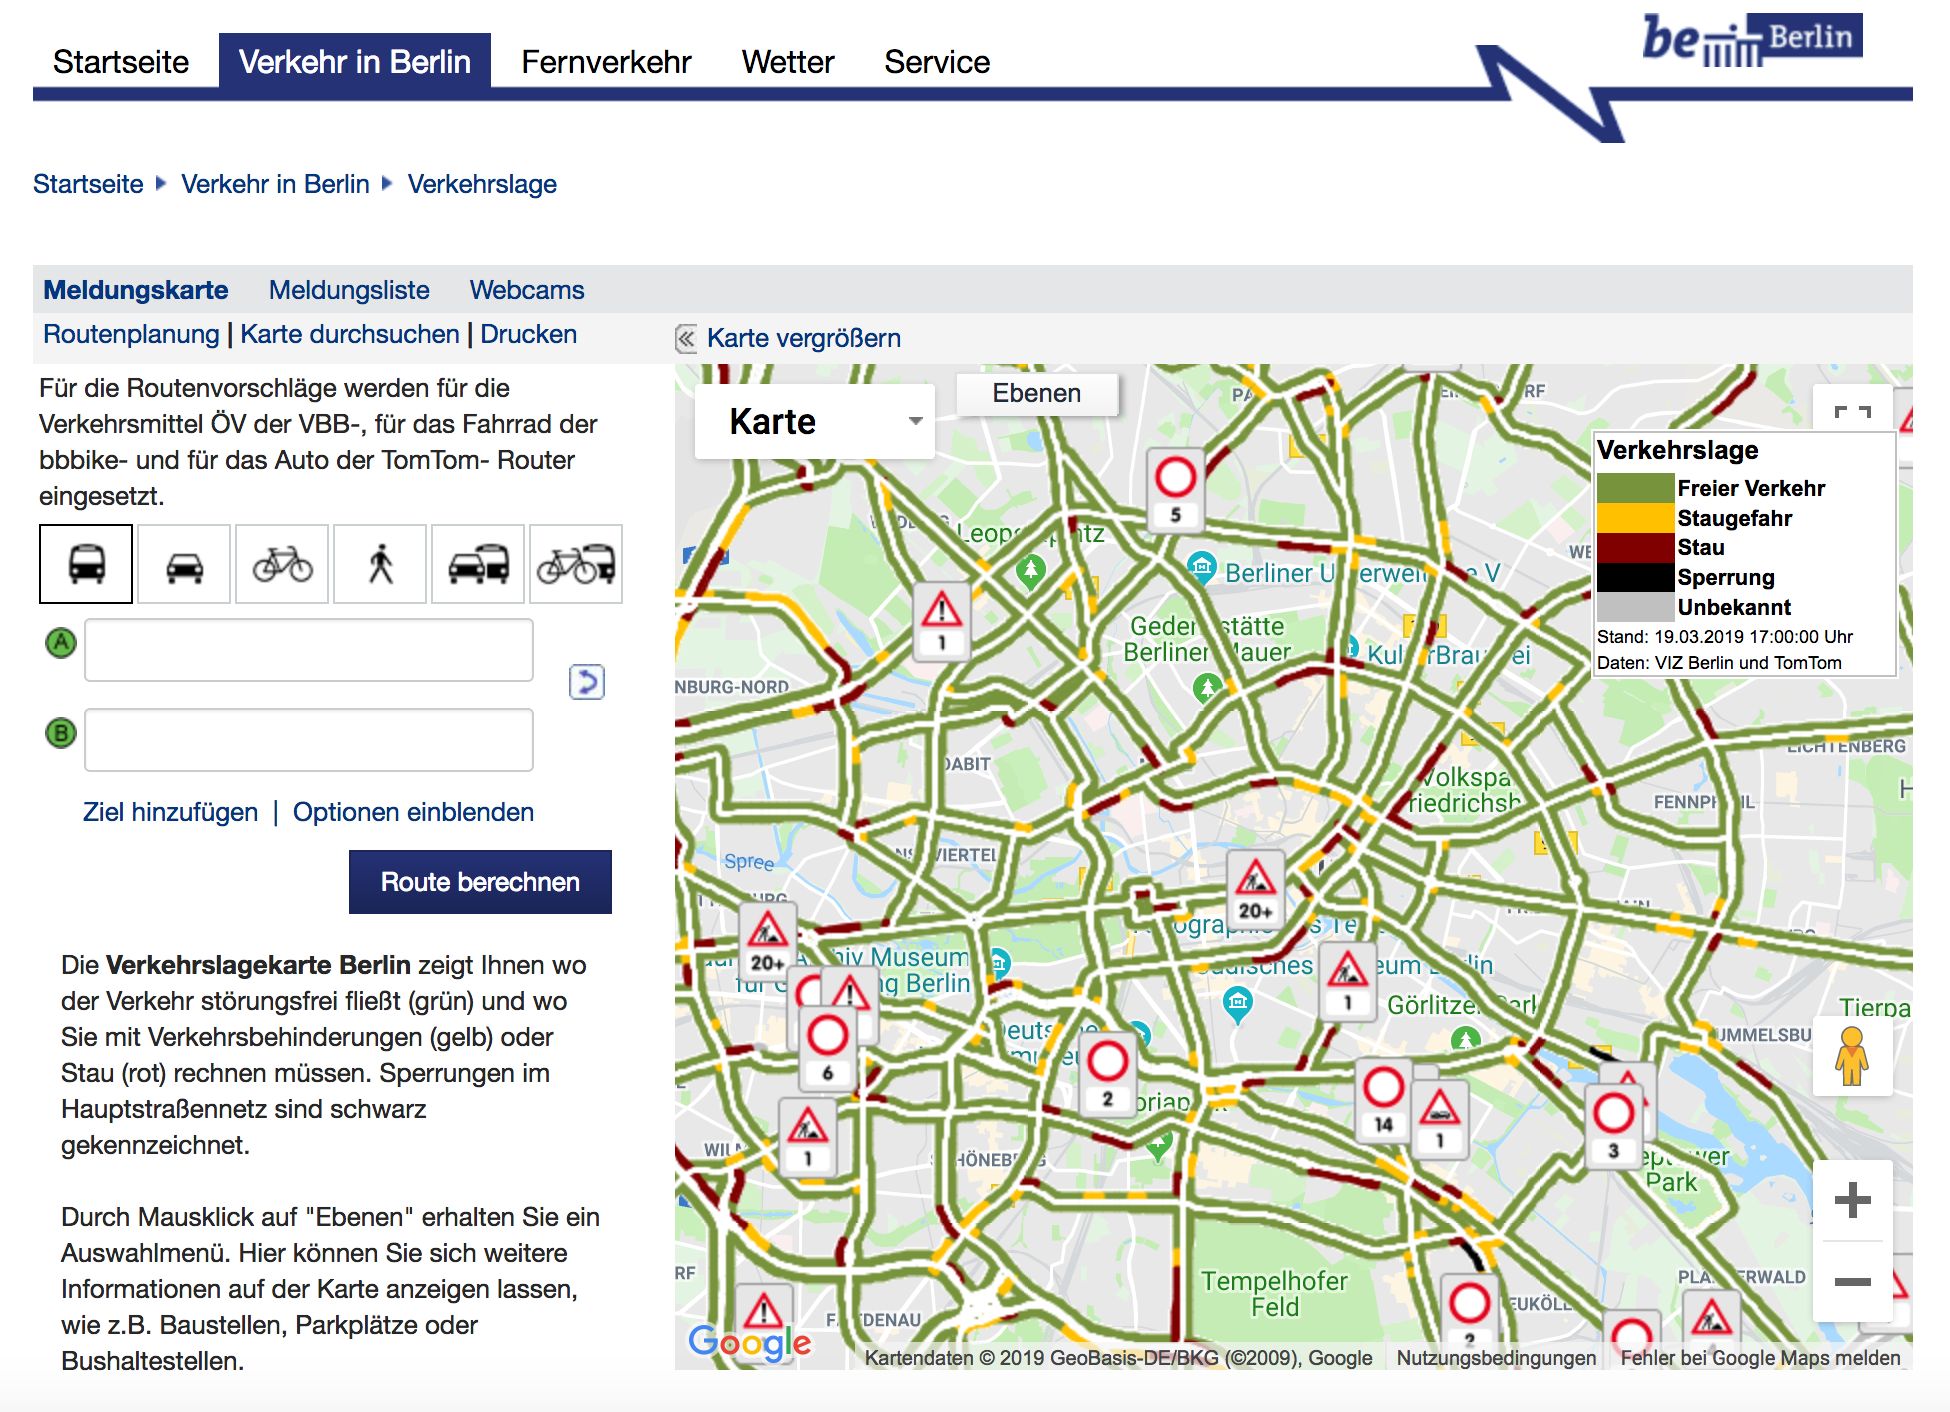
Construction projects can have a huge impact on movement through the city, regardless of whether people are riding a bike or driving a car. Information on road construction is not currently available as Open Data in Berlin. The Verkehrsinformationszentrale Berlin maintains a website that includes a “Verkehrslagekarte”, showing current traffic conditions (including listing road closures due to construction). But there is no raw data provided, just the map and an HTML list of all alerts shown on the map. Moreover, this map only shows information for major roads in Berlin. Information on more localized road closures and construction projects is again handled independently by each Bezirk (specifically, their Straßen- und Grünflächenamt). Again, finding accurate and up-to-date information for each Bezirk is difficult and usually requires sifting through many websites that appear to be infrequently maintained.
Damaged roads and bike paths
Status: Limited non-open data available
Similar to construction, damaged roads create challenges for riders and drivers alike, thus knowing the location and nature of damaged roads can help citizens plan their routes smartly. There is a central Ordnungsamt Online portal that citizens can use to report damaged streets (among other issues). Although the reports themselves are public, the portal does not currently plot them on a map (making it hard to find the reports that might be relevant for you and your route), nor does it allow for the data on reported issues to be exported as structured data. Thus, it’s not really possible to use this portal to get an overview of road quality across Berlin and what areas might be of concern for cyclists.
Many Bezirke also have their own feedback mechanisms for reporting damaged roads. But most of these do not make reports public or otherwise provide information on where in the city residents are reporting problems with streets, meaning there is again limited potential for cyclists to inform themselves in advance. A parliamentary enquiry from July 2018 detailed how some of the Bezirke handle damaged bike routes, including current and future plans for repairing damaged routes.
Location of traffic lights
Status: Open data available
Bike riders concerned with choosing the most efficient routing possible may want to avoid roads with a lot of traffic lights. There is a map in the FIS-Broker which indicates the location of traffic lights (Lichtsignalanlagen) across the city.
- Location of traffic lights (FIS-Broker map)
- Geospatial data available for download via the Lab data portal
Location and quantity of bike stands
Status: No (known) data available
Knowing whether and how many bike stands a given location (such as a train station, for example) has can give you an idea of how feasible it is to park your bike safely there (and thus whether it’s worth it at all to bike there). However, this information does not appear to be collected and stored in any systematic way. A parliamentary enquiry from June 2018, for example, indicated that the central city administration does not have information on how many bike stands are available at public transportation stops; this information would be held by individual Bezirke, none of whom currently make this information available (assuming they have it in a structured form to begin with).
Open Street Maps does include bike parking spots in its map. Whether the location and numbers listed on the map are accurate, we can’t evaluate, but this is one alternative resource for obtaining this information.
Bike infrastructure usage
Bicycle accidents
Status: Limited non-open data available
Data on where, when and with what frequency bicycle accidents occur is not currently available as open data. The Berlin Police do release a yearly report on traffic accidents involving bike riders, but these reports are exclusively published in PDF form. The data is generally structured tabularly, however, meaning it can theoretically be extracted and converted into a machine-readable format. These PDFs do contain a comprehensive list of where every accident occurred, but the highest level of detail available is street crossings (i.e., there are no coordinates provided).
For individuals comfortable with running a script to extract data from the PDFs, Stephan Wehrmeyer has developed a parser for the reports and made it available via GitHub. This is not a perfect solution, since in many cases the accident location discriptions are too vague to be of genuine analytical use, but this is nevertheless a helpful step toward making this data usable in some form. Stefan has also produced map visualizations for the data for the years 2017, 2016 and 2015 (but again, the visualizations are not precise since the data itself is not precise).
Update December 2018:
Another potentially interesting source of information is this map and table of known problem areas from the Unfallkommission (“Accident Commission”), which is part of the Senate Department for Environment, Transport and Climate Protection. The information is structured as a table but is not highly detailed (for example, specific coordinates or other georeferences for locations are not provided). Moreover, the data covers all manner of auto-involved accidents, not exclusively limited to those involving bike riders.
Volume of ridership
Status: Open data available
The Verkehrslenkung Berlin gathers data from 26 different sensors in 17 locations that automatically measure the volume of bike traffic in that area. The data can be browsed as part of an interactive map, or downloaded as an Excel file. The Excel file contains hourly data starting in 2012, but for 2012-2014 there was only one measuring station. The file is not currently in the Berlin Open Data portal, but it is available for download on the Verkehrslenkung website. For more specific questions about how the data is gathered, there is a FAQ page. In addition to this dataset, the Senatsverwaltung for Environment, Transport and Climate Protection also publishes a yearly bike traffic census that features aggregate monthly data for several sites across Berlin. These reports do include historical data for individual locations as far back as 1982, but only in PDF form. The reports are available for download via the Verkehrslenkung Berlin’s page for traffic-related surveys (right-hand column under “Fahrradverkehr- Pegelzählungen”).
Recently, we published our own analysis and visualization of the data from Berlin’s counting stations. The data can be explored based on different temporal inputs (e.g., looking at the data by month/year, or by type of day/time of day), meaning you can see for yourself how bike traffic waxes and wanes based on different factors.
A related metric for gauging ridership is data on the number of bicycle tickets purchased within Berlin’s public transportation system. A 2013 parliamentary enquiry revealed specific numbers for 2008 to 2012.
- Map of current volume of cycling traffic (website)
- Spreadsheet of cycle traffic volume for 2012-2017 (Excel file)
Volume of auto traffic
Status: Open data available
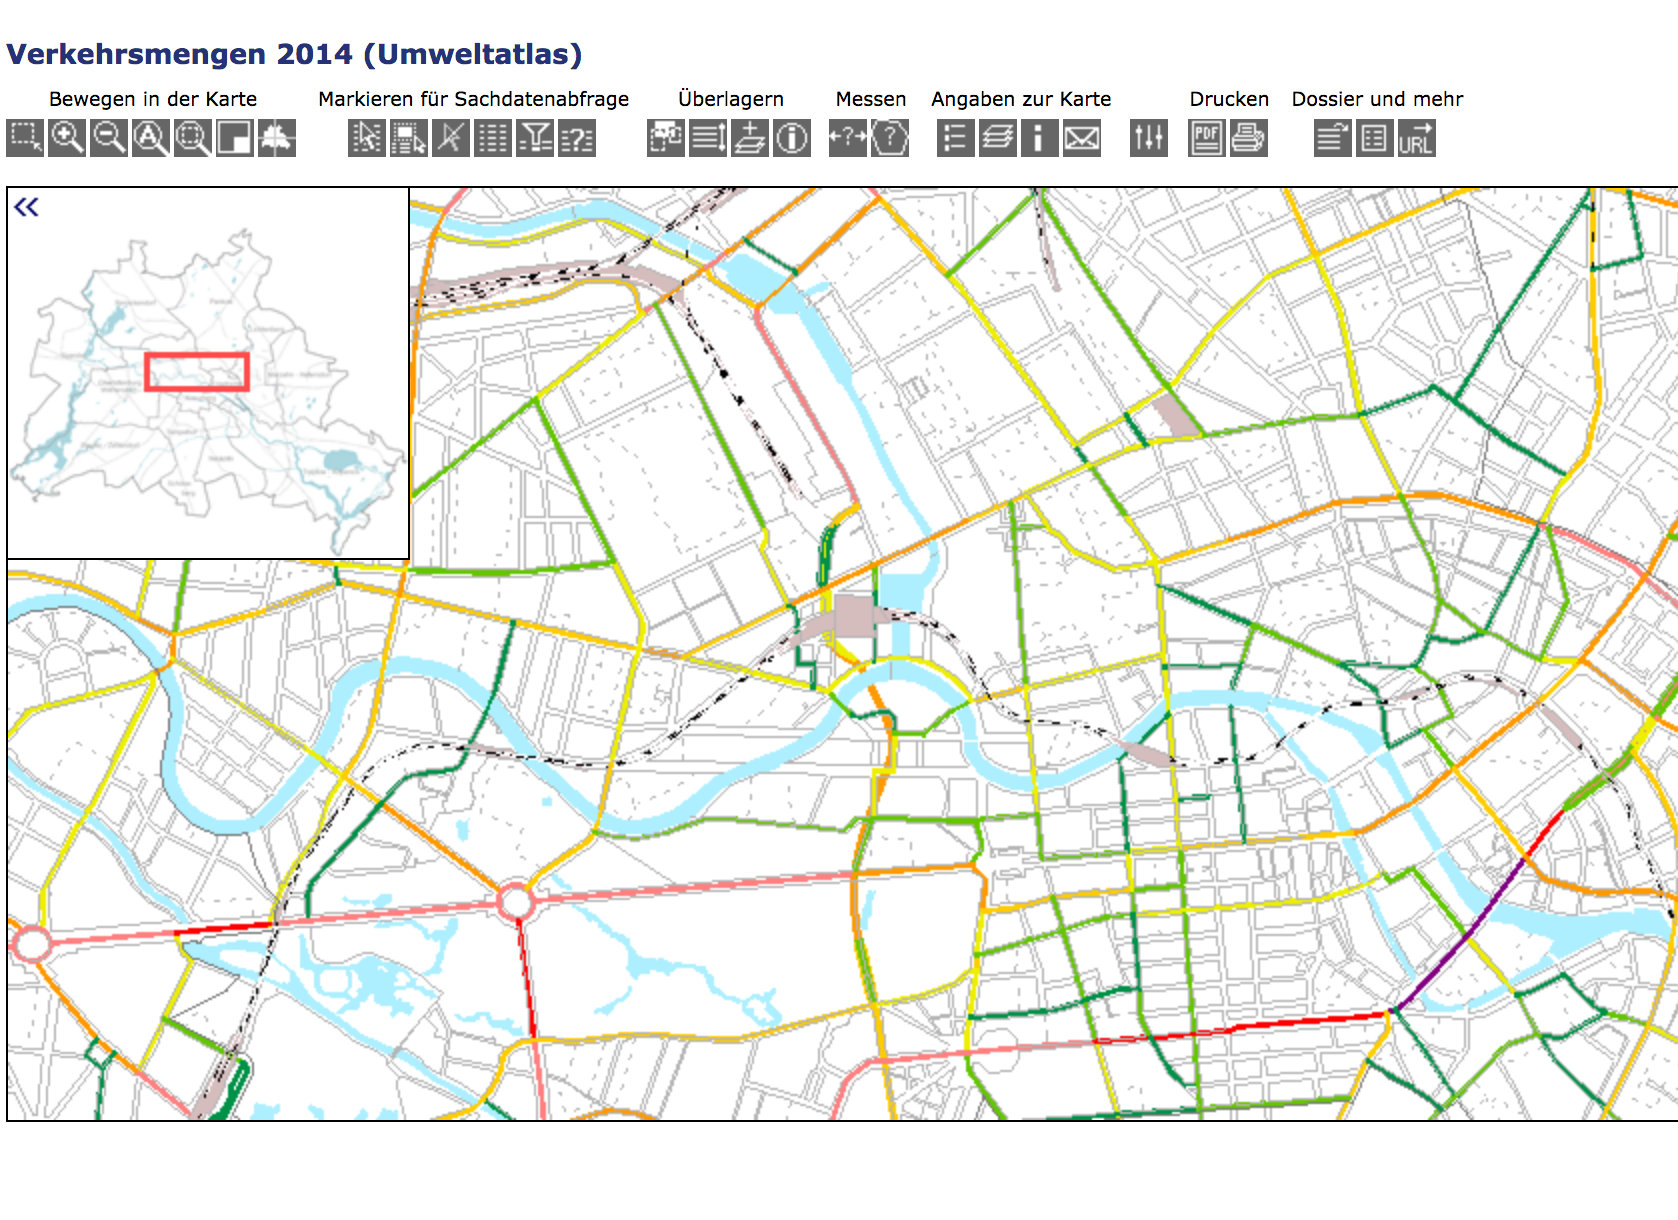
The volume of traffic on a given road naturally has a predictable impact on whether that road is suitable or at least ideal for bike riders – many riders would probably prefer to travel along less busy streets, if such adjustments can be made without sacrificing route efficiency. Berlin’s FIS-Broker contains a map of automobile traffic volume (encompassing all types of motorized traffic: cars, trucks, motorcycles, etc.). The current map was released in 2017, though its actual data is based on numbers observed in 2014. A report (available in English) from the Senatsverwaltung for Urban Development and Housing accompanying the map provides more information on the data, including how it was gathered and prepared.
- Map of motorized traffic volume (FIS-Broker map)
- Geospatial data available for download via the Lab data portal
Miscellaneous
Bicycle thefts
Status: Limited non-open data available
Where in Berlin should bike riders take the most caution with securing bikes? Of course, no part of the city is safe from bike theft, but there are parts of the city with significantly higher rates of the crime. This data (like other crime-related data, such as bike-involved accidents) is not currently released as open data. A 2018 parliamentary enquiry, however, at least saw the data for “hotspots” (e.g., areas with the most reported thefts) released in tabular form for the years 2015-2017, albeit within a PDF. The data is broken down by Bezirk and Planungsraum (a Planungsraum is one of the many sub-units a Bezirk can be broken into; more information on these sub-units can be found in this Lab blog post). Only the top five Planungsräume with the most reported thefts are shown. A similar enquiry from 2015 revealed yearly data on bicycle thefts per Bezirk for the time period of 2010 to September 2015.
Update December 2018:
The police have released machine-readable data on bike thefts for 2012 - 2017 as part of the Kriminalitätsatlas” (crime atlas). The dataset includes statistics for the number of overall cases as well as the rate per 100,000 residents; both are available per Bezirk and Bezirksregionen. The excel file can be downloaded directly here via the Berlin Open Data Portal.
CSV file extracted from the tables in the 2018 enquiry:
Bikesharing
Status: Limited non-open data available
The number of bikesharing companies operating in Berlin has exploded in the last year. Although it’s easy to see with your own eyes just how saturated the market in Berlin has become (although the numbers seemed to have waned a bit in previous months), specific figures on the number of companies active in Berlin and the number of bikes available across the city are harder to locate. A parliamentary enquiry from February 2018 offered specific numbers for one company (Deezer Nextbike), but only general figures for the other six companies known to be operating in Berlin at that time. Specific figures for the number of bikes and companies active in Berlin were again requested through an from June 2018, but the Senatsverwaltung for Enivronment, Traffic and Climate Protection indicated it had no specific numbers to offer beyond what was named in the previous enquiry.