How to publish sensitive data openly: Berlin's Crime Atlas
Open Data lessons from Berlin's Police
“We’d love to be able to publish this data, but we’re worried it’s too complicated and too sensitive. People might misinterpret it or use it to put us (or the areas we represent) in a bad light.”
In our work supporting the Berlin City Administration with Open Data via the Open Data Info Point (ODIS), this is one of the most common justifications we hear for why a government body doesn’t want to publish a given dataset. Government employees are often fearful that potential data users lack the expertise to use their data “correctly”, as well as that they will use the data to highlight negative aspects of either the government itself or the areas that the data covers. In the eyes of these government employees, there is little to be gained by publishing this data but a lot to lose.
The typical response from open data advocates to these concerns is to emphasize the need to provide context and guidance to potential data users to help them understand and interpret the data. If the government’s concerns are genuine – i.e., the data really is difficult for a lay person to understand or use, and these concerns aren’t simply being voiced as an excuse not to have to publish data – then they shouldn’t leave it up to users to stumble their way through the dataset. Rather, the government should take users by the hand and walk them through this data, helping to ensure the data is understood and used correctly.
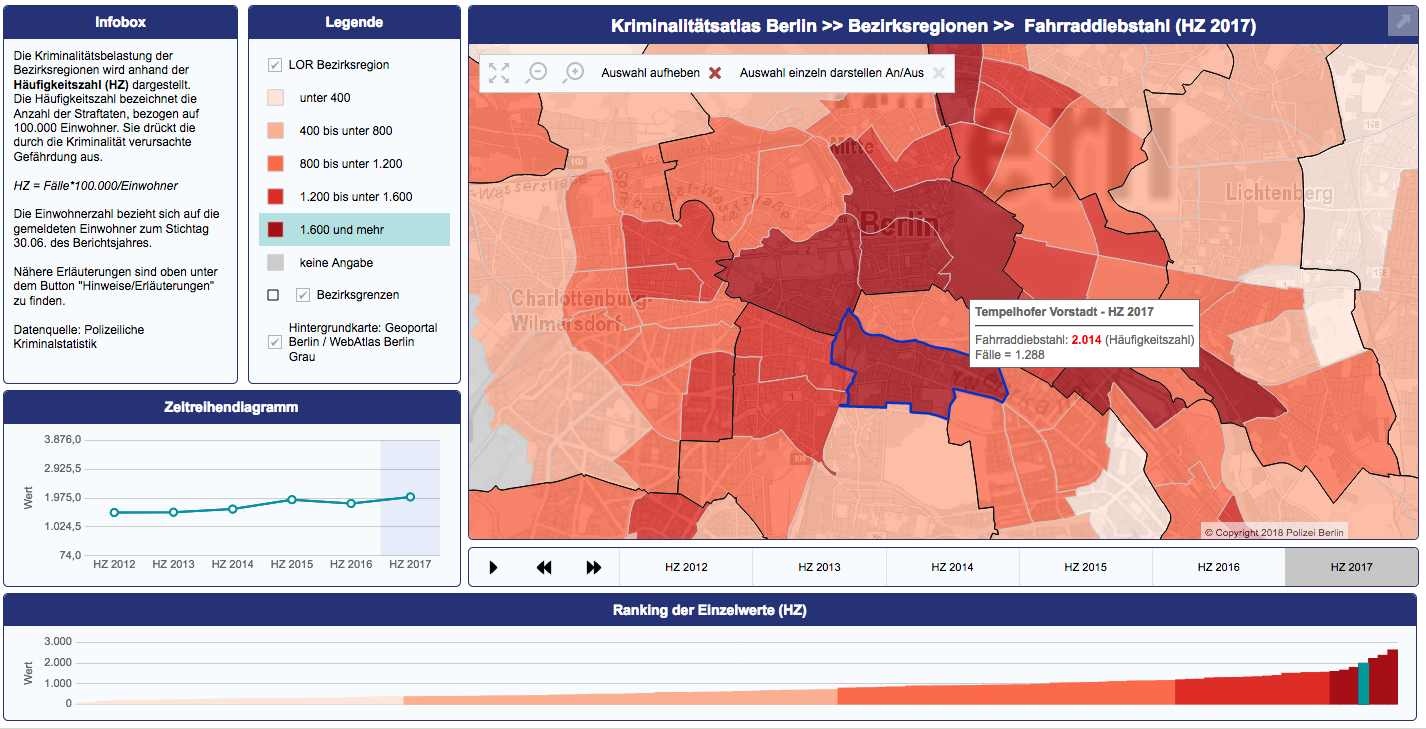
But what does this strategy look like in practice? Berlin’s recently published “Crime Atlas” (German: Kriminalitätsatlas) provides an excellent example. The interactive website shows the rate of occurrence of certain types of crimes (theft, robbery, home break-ins, etc.) across the city, allowing users to explore the data in different ways (as maps, bar charts, line graphs, etc.) as well as to download the data as an Excel table (here is a link to download the data directly via the Berlin Open Data Portal). This is the first time this data has been published in an interactive and machine-readable form in Berlin.
The Berlin Police presumably had many similar concerns to those mentioned earlier in this article – that crime data is too sensitive and too easy to misinterpret to be released as open data that anyone can use and analyze (this would explain why it took so long for the data to be released to begin with). To tackle these concerns, the police published a significant amount of contextual information alongside the visualized data to help users understand what the data does – and doesn’t – show. All of this information can be found under the “Hinweise/Erläuterungen” tab of the Crime Atlas.
In doing so, the police have set an excellent example for other government bodies to follow, both in Berlin and beyond. Here are a few notable features of the Crime Atlas that show how governments can successfully publish sensitive or complicated types of data.
1) The atlas explains what variables the data includes and how they were chosen.
The Crime Atlas only contains data for a specific set of crimes. These include crimes like muggings, bike thefts and drug-related crimes. The dataset does not include statistics for more serious crimes, like murder or rape. But rather than simply allowing data users to fill in the blanks as to why some crimes have been featured and not others (which could open the door for the police to be criticized for cherry-picking data, for example), the Crime Atlas lists out four explicit factors that were used in the selection of the featured crimes: the ability to connect the crime with a specific location, the breadth of available data on the crime, the relevance of the crime for the general public, and the preventability of the crime.
This doesn’t mean the police are beyond reproach for their choice of which data they included and which data they did not; there is still room to criticize the police for not releasing a wider swathe of data, for example. But by providing this background information, the police enable data users to understand this data in a given context (e.g., these crimes were chosen because they have a high level of relevance for the general public and they can conceivably be avoided) and the police also avoid looking as though they are simply releasing random statistics with little widespread relevance.
2) The atlas explains statistical terms and how they should be understood.
The Crime Atlas makes use of statistical concepts that many of the general public may not initially be familiar with. Numbers are presented both as the total number of cases for a given crime and as a “frequency number” (German: Häufigkeitszahl), which shows how often a crime occurs for every 100,000 residents in a given region (in the case of the Crime Atlas, the regions are either the individual Bezirke, or the “Bezirksregionen” that make up a Bezirk). Knowing that not everyone will understand this number, the Crime Atlas page both explains what the term frequency number means and also visualizes how it is calculated (number of crimes times 100,000, divided by the population of the region in question).
Moreover, the atlas also explains what factors have an influence on this number being higher or lower – for example, the atlas points out that areas with a high appeal for tourists (like those areas in the center of the city) or which host many large-scale events (like the areas around the Tiergarten) will likely see much higher frequency numbers for crime than other areas. While for some people the connection between these factors and higher frequency numbers is obvious, for others it may be new information. And if the police want to ensure their data is correctly interpreted, it’s a good idea for them to be explicit about how their statistics are calculated and what contextual factors are important for understanding these numbers.
3) The atlas provides additional context for the six areas with the highest crime rates.
A major reason why police departments the world over are often reluctant to publish crime data is because of a general fear that this data will be used to cast a city – or specific parts of a city – in a negative light. People will see the data and conclude, rightfully or wrongfully, that crime is far too high and that the police don’t have a good control of the situation, or at least that certain areas of the city are much less safe than others.
But numbers alone don’t always tell the whole story. As mentioned above, for example, some regions end up with higher rates of crime because of circumstances that make crime more likely or lucrative, but that aren’t necessarily related to a region being dangerous. Again, think of regions that have higher amounts of tourists, who often make easy targets for criminals – the higher rate of reported crime in Berlin’s central tourist districts doesn’t necessarily mean those districts are more dangerous or lawless than others.
In the Crime Atlas, the Berlin police offer brief analyses of the 6 Bezirksregionen with the highest crime rates. In these analyses, they offer important contextual information to help users better understand what the data is saying (and not saying). For example, Tiergarten Süd is one of these high-crime areas. This area includes the Straße des 17. Junis and the Großer Stern, where many of Berlin’s biggest street festivals (like its New Year’s celebrations) occur. This region also includes the heavily-touristed Potsdamer Platz. With all these factors put together, it’s easy to understand why Tiergarten Süd has such a high crime rate and that the numbers themselves don’t necessarily mean the area is excessively dangerous. In the case of Moabit-Ost, also a region with a high crime rate, one must consider the fact that the Hauptbahnhof is located in this region. The Crime Atlas notes that if all of the Hauptbahnhof-associated crimes were left out of the data for Moabit-Ost, the region would be ranked 35th rather than 6th for highest crime frequency.
None of this should be understood as meaning that crime is not at all a problem in Berlin and all seemingly-high numbers can be explained away with a little context. This is why it is critical to not just release visualizations and explanations of the data, but also to release the raw data itself – at the end of the day, data users must still have the ability to analyze the data themselves to both verify the narrative being promoted by the government and to reach their own conclusions. But the Berlin Police have shown that it is indeed possible to release complicated, sensitive data in a way that preserves the spirit of open data but which also ensures the users are guided away from incorrect or incomplete assessments of the data.