Bike-share flows in Berlin
What kinds of information and insights can we glean from bike-sharing data?
In the last few months, the Ideation & Prototyping Lab has been working intensively on the subject of bike- and scooter- sharing in Berlin. We’re focusing on these topics more because of the increasing importance of shared mobility operators in the transition toward more sustainable transport options, as well as because of the valuable insights into mobility behavior that can be gained by analyzing data from shared mobility providers. Our data analyst Alexandra Kapp has evaluated hundreds of thousands of bikeshare trips in Berlin; the first results of this analysis are reported here.
There are more than 10,000 rental bikes on Berlin’s streets that have been made available through various providers. These thousands of bikes – and the large quantities of data they generate – have the potential to answer a variety of useful questions for the city: For which routes are the bikes used? How often are the bikes being used? What time of day are most journeys?
Over the last 3.5 months, we have collected and evaluated data from three different bike-share providers in Berlin (Nextbike, Lidlbike and Mobike).
The following table shows the total number of bicycles deployed during the period of analysis.
| Total | Nextbike | Lidlbike | Mobike | |
|---|---|---|---|---|
| Unique bikes over the entire period | 15,375 | 2,396 | 3,633 | 9.346 |
After reviewing the data, we decided to exclude Mobike’s data from any further analyses due to its unreliability. All additional analyses in this post are based on data from Lidlbike and Nextbike.
The nextbike data only includes data of free-floating bikes: there is no data for bikes being rented or returned at stations. Therefore, the analysis has only limited validity.
The average daily distance travelled with all bicycles from both providers is 8,181 km (median: 8,760 km) with an average of 2,830 rides of 2.9 km each (median: 2.4 km) per day. The median trip length is 30 min, but the average length is 1 hour and 36 min, which indicates there are some outliers in the datasets representing unusually long rental periods.
Bike-sharing: Improved mobility or merely a source of amusement for tourists?
During the week, most trips start between 8 a.m. and 10 a.m. in the morning and around 6 p.m. in the evening. On weekends, most trips occur around lunchtime.
If you compare these results with Civity’s analysis on e-scooters, one notable clear divergence between shared e-scooters and bike-shares emerges: E-scooter usage does not correspond to the typical rush hour patterns – there are more e-scooter journeys on weekends than during the week, and during the week there are no morning and evening peaks. But based on the graph above, we can see that bike-shares do indeed conform to these rush hour use patterns. This makes it clear that the user groups for bike-sharing and e-scooter-sharing do not necessarily overlap, and thus that these two developments may need to be separately handled when it comes to analysis and even regulation.
30% of available bicycles are used daily
On any given day, around 30% of the available bikes are actually moved from one location to another (median value). Each bike is ridden 1.8 times a day, on average.
15% of rides start or end at subway stops
A common justification for the need for an expansive bike-share network is that these vehicles can serve as transport for the “last mile” – i.e., that the bikes can cover the remaining distance between a public transit stop and a person’s actual starting point or destination. To this end, it’s illuminating to see how often bicycles are rented at underground and suburban train stops. Approximately 15% of our registered rides start in the vicinity (100 m radius) of a stop. A particularly high number of trips start at the Hauptbahnhof (Central Station), Potsdamer Platz and Bahnhof Zoo.
The following map shows how often bikes are rented in the vicinity of a given tram, S- or U-Bahn station.
Highest number of trips are to and from Alexanderplatz
Currently, bike-share offerings are generally limited to within the Berlin S-Bahn ring. Within this ring, the largest number of trips start in Mitte and Friedrichshain-Kreuzberg. The areas around Alexanderplatz and Oranienburger Straße are particularly popular starting points.
As can be seen from the data, residents outside the ring hardly benefit at all from Berlin’s current bike-share offerings. Yet when we talk about the problem of the “last mile”, it is precisely these residents outside the ring who suffer from this problem (e.g., extended distances between people’s homes and the next reliable public transit stop) most acutely. The data shows us that if this is truly a problem the Berlin government and/or the bike-sharing operators want to address, then there needs to be significant work done to expand offerings beyond the ring.
The data can also be useful when it comes to planning space for bike racks and other parking options: Areas that see higher concentrations of rental bicycles, such as certain underground or S-Bahn stations, can also be good indicators of where there is a pressing need for additional spaces to park or secure bikes.
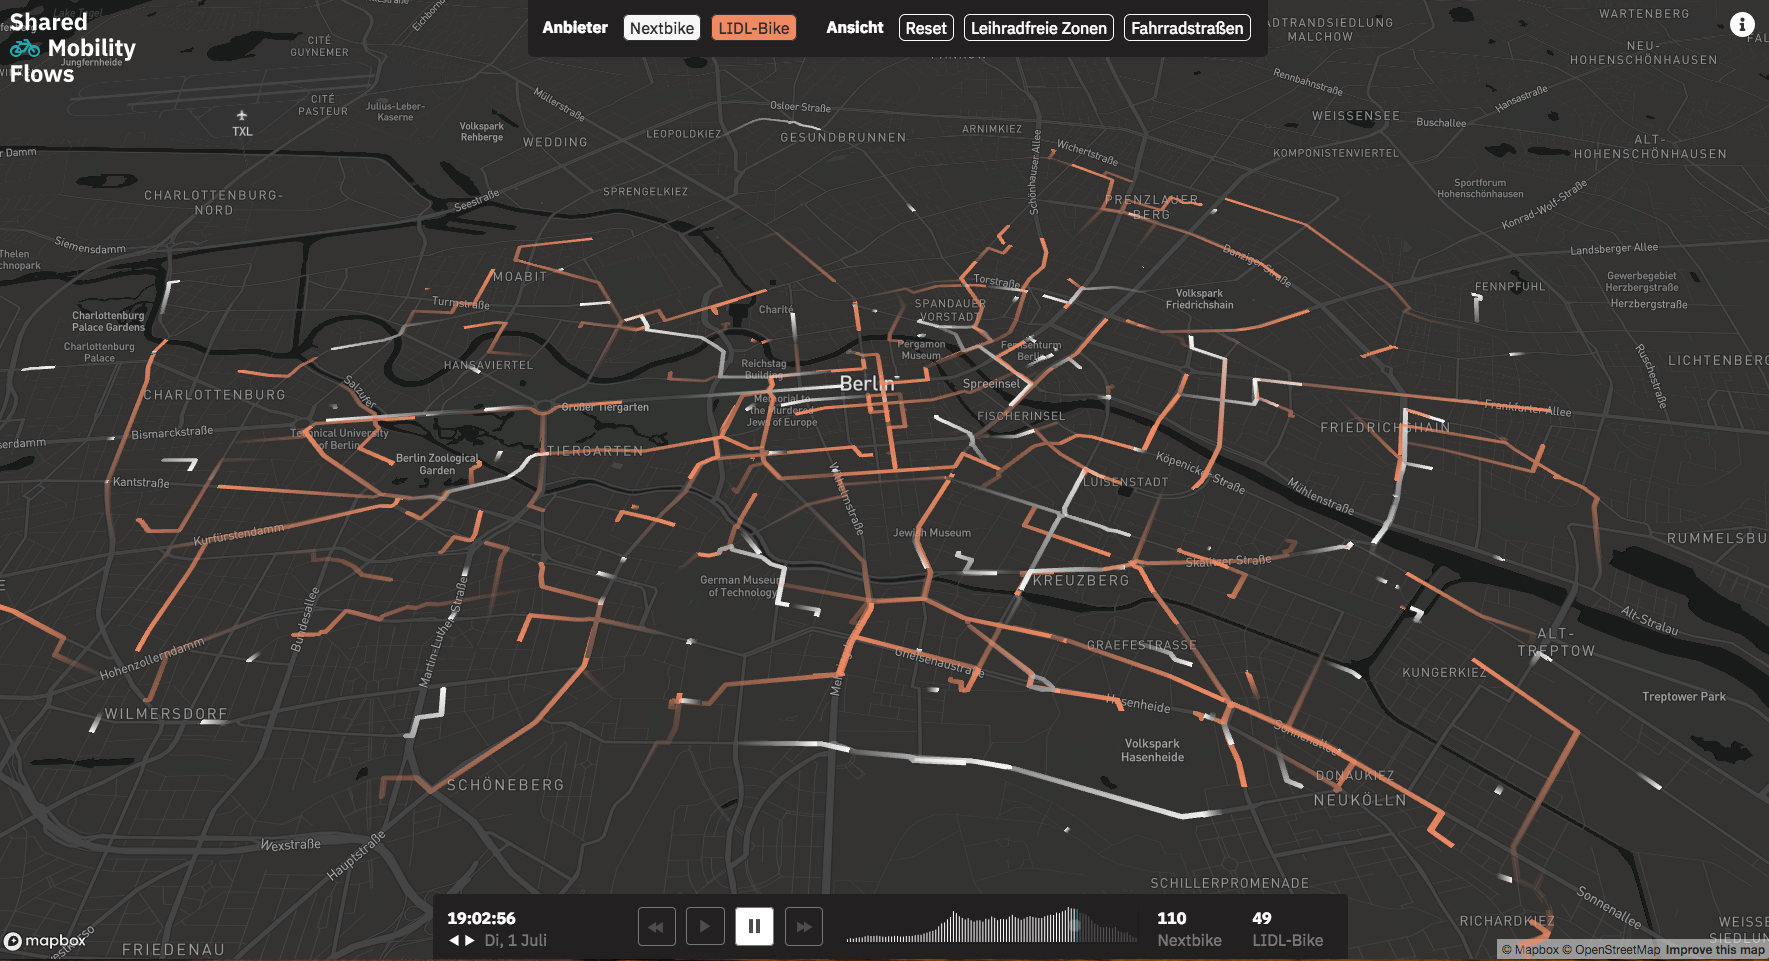
Visualization
A visualization of the individual rides was created as a CityLAB project and is available here. The routes of Lidlbikes and Nextbikes can be viewed for individual days and times.
Data sources
To gather this data, we queried the APIs from Mobike, Lidlbike and Nextbike every four minutes for the location of bicycles during the period of April 1 to July 11 (more information on the APIs is available here). We derived start and end points for the trips based on the location data contained in the database and calculated probable routes using OSRM. The dataset was cleaned to remove outliers and implausible data. This includes journeys under 200 meters, journeys with start and end points outside of Berlin, and journeys faster than 30 km/h. This resulted in a dataset of almost 0.6 million trips. The data from Mobike was excluded from the analyses here, as these data were very error-prone and, in many cases, simply implausible. This resulted in a dataset containing 300,000 rides using Lidlbike and Nextbike over a three-month period. For more details on how the data was prepared, see the Jupyter Notebooks here.
Note: The article was edited on 2019-9-25: the data of nextbike was specified to only include “free-floating” bikes.